Trading Forex with Bollinger Bands: Breakouts and Bounces Bollinger Bands are a powerful technical indicator that help forex traders identify volatility, breakout opportunities, and mean reversion zones. Developed by John Bollinger, this tool uses standard deviation...
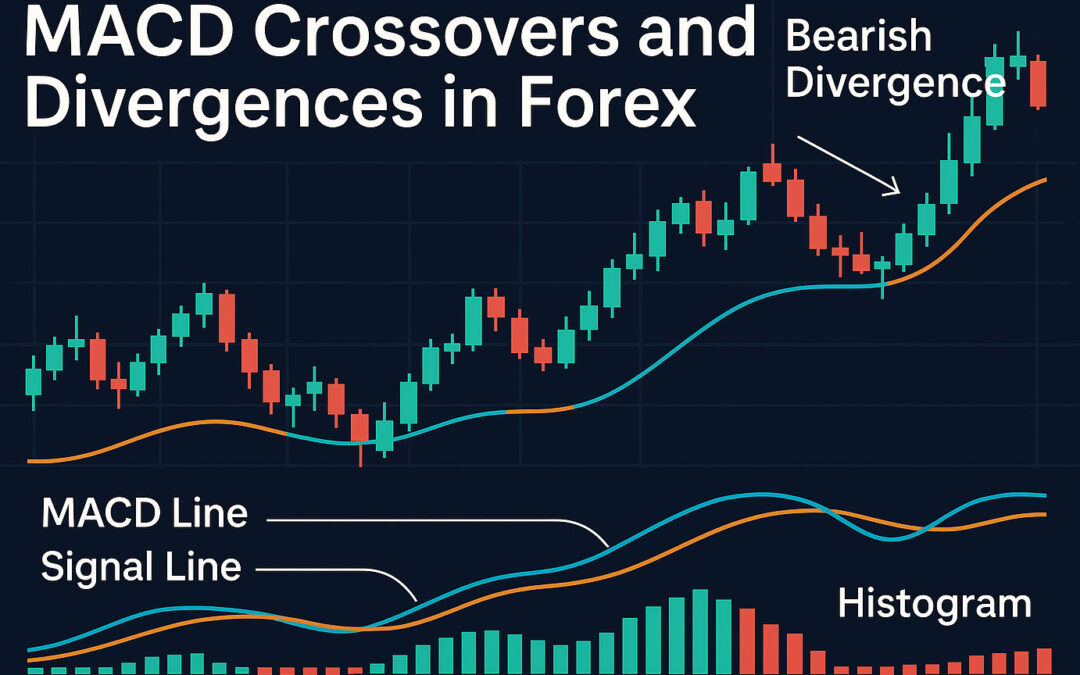
MACD Crossovers Indicator
How to Read MACD Crossovers and Divergences for Forex Profit The Moving Average Convergence Divergence (MACD) indicator is a widely used tool in technical analysis that combines momentum and trend-following principles. It helps traders identify potential buy and sell...
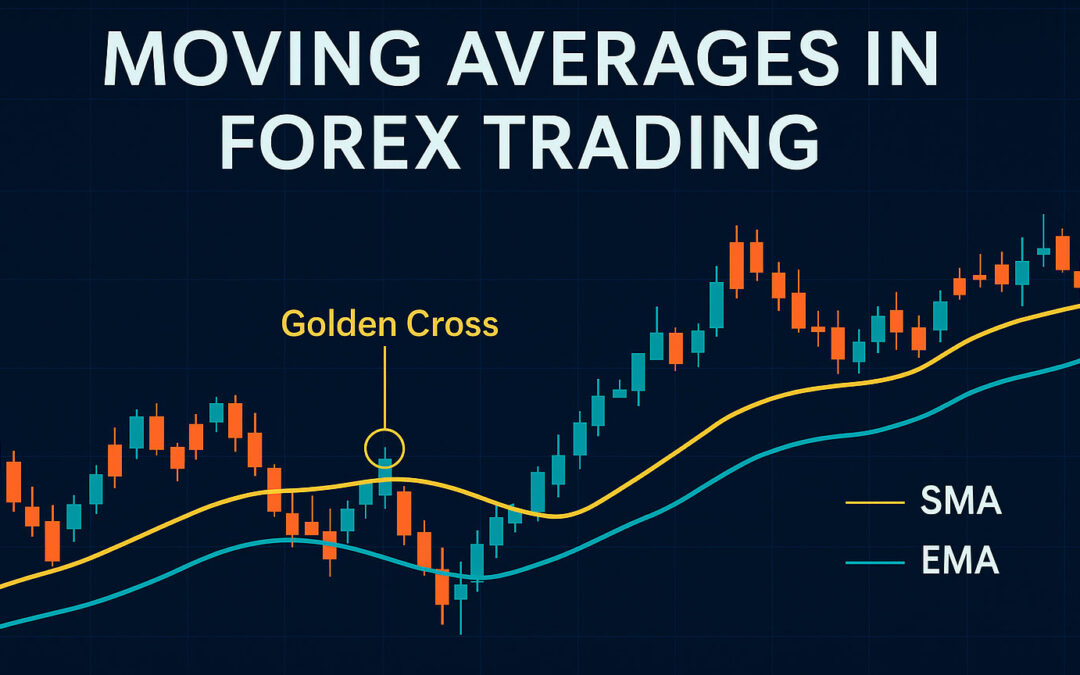
Moving Averages Indicator
Mastering Moving Averages in Forex Trading: SMA vs. EMA Explained Moving Averages (MAs) are foundational tools in technical analysis, widely used by forex traders to identify trends, define support and resistance levels, and generate trading signals. In this guide,...
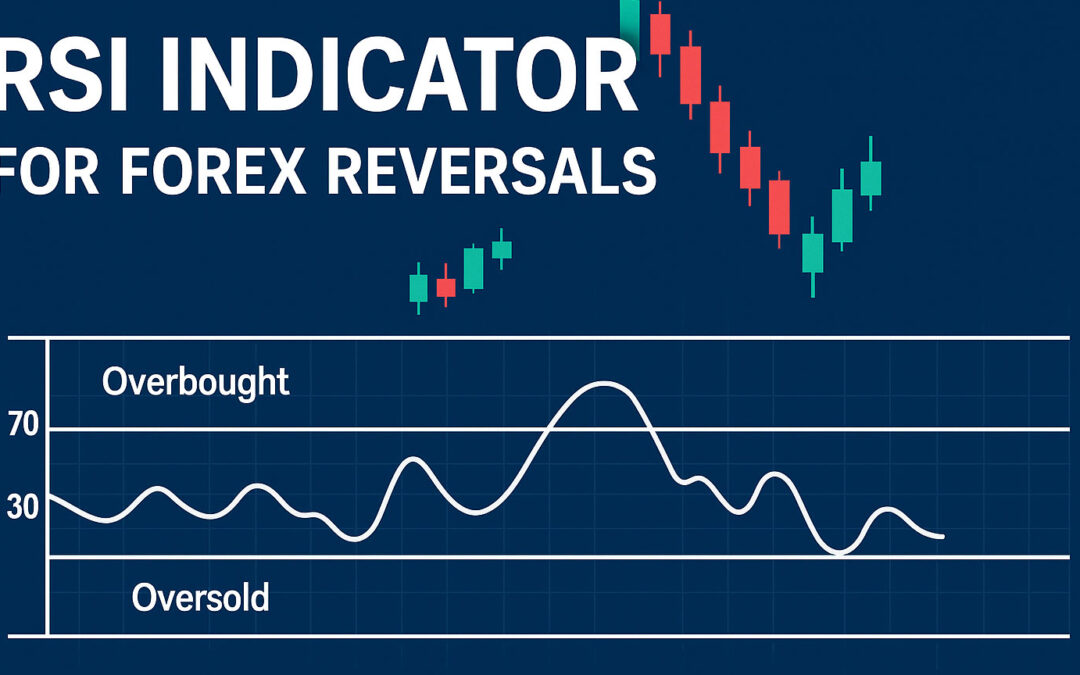
RSI indicator
Using RSI to Time Forex Market Reversals The Relative Strength Index (RSI) is one of the most popular momentum indicators used in technical analysis. It helps traders identify overbought or oversold conditions and potential reversal zones. In this post, we’ll explore...
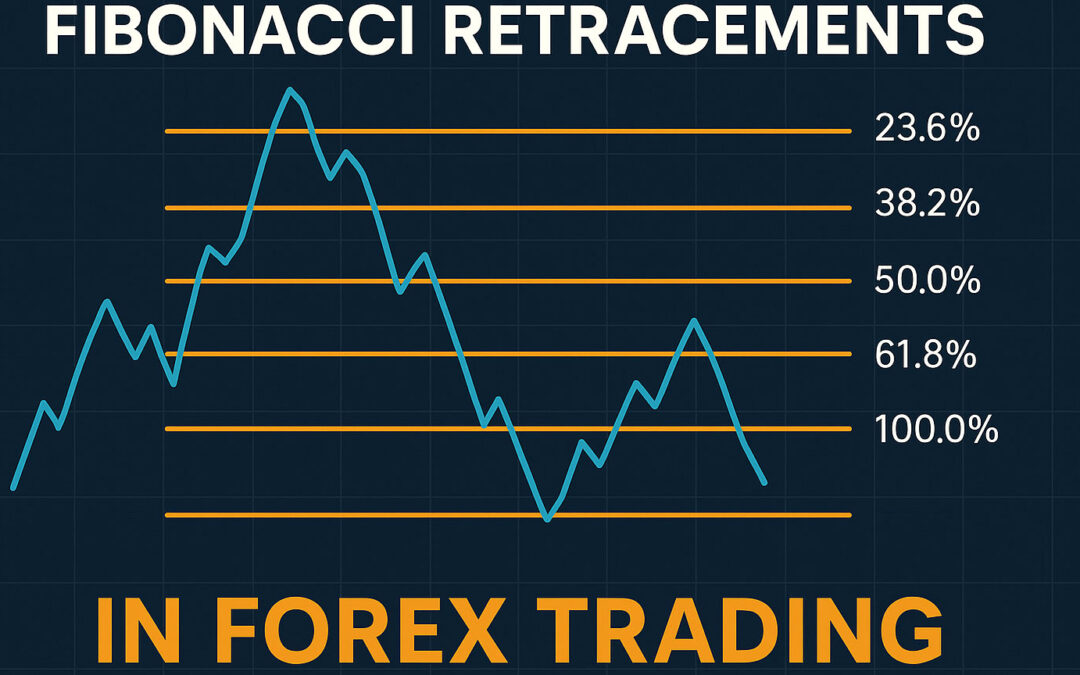
Fibonacci Retracements Indicator
Mastering Fibonacci Retracements for Profitable Forex Trading Fibonacci retracement levels are among the most reliable technical analysis tools available to traders. They help identify potential reversal points on price charts, significantly improving trading accuracy...
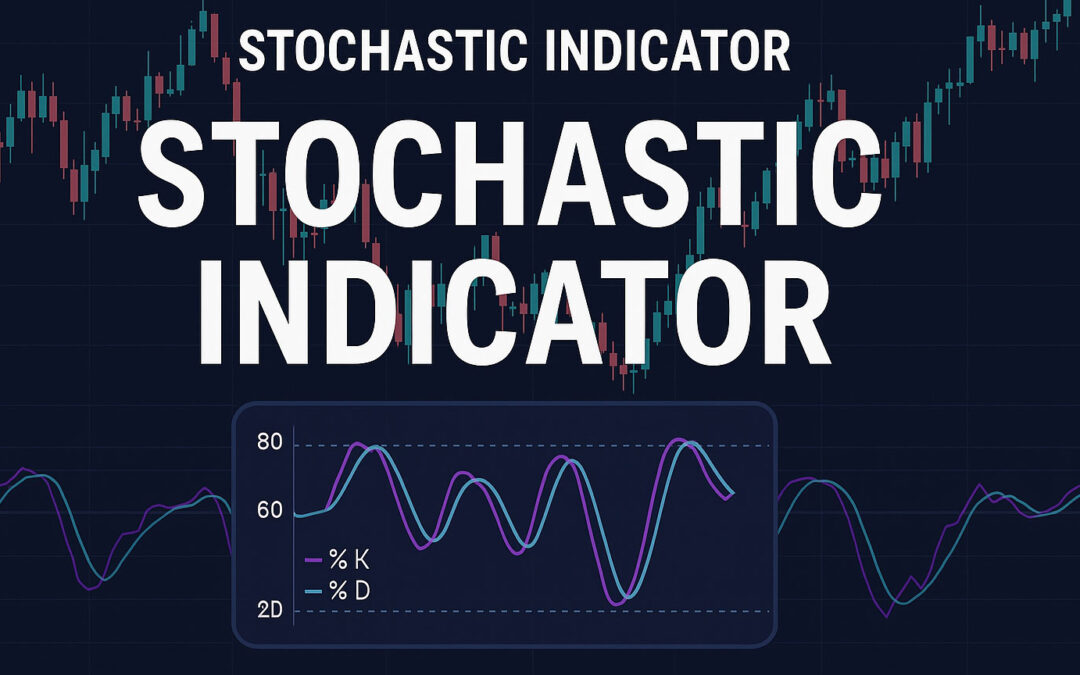
Stochastic indicator
How to Use the Stochastic Indicator in Forex Trading The Stochastic Oscillator is a widely used momentum indicator developed by George C. Lane. It helps traders identify overbought and oversold conditions by comparing a closing price to its recent price range. Below,...