
Technical analysis · Momentum
Stochastic Oscillator for Forex: Settings, Crossovers and Range Trading
Stochastic measures where a close lies within its recent high–low range. Its 20/80 zones are descriptions of price location, so a crossover needs a separately defined trend or range context.
Price location within a recent range
The Stochastic Oscillator asks where a candle closed relative to the highest high and lowest low in a lookback window. A reading near 100 means the close is near the top of that range; near zero means it is near the bottom. It does not measure the probability of the next candle rising.
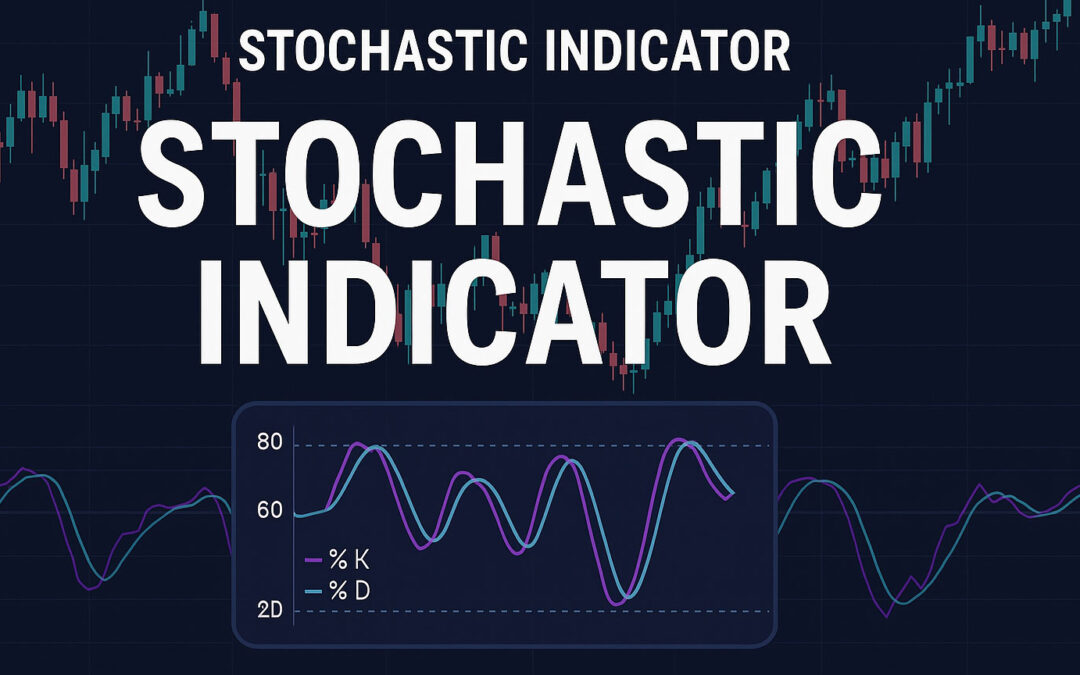
The main curve is %K and the signal curve is %D. Traders commonly watch 20 and 80 as lower and upper reference zones, along with crossings between the curves. A strong upward trend can keep producing closes near the top of its rolling range, so repeated readings above 80 do not require a reversal.
RSI and Stochastic answer different mathematical questions: RSI compares smoothed positive and negative changes, whereas Stochastic locates the close inside a range. They are both price-derived oscillators, however, so agreement should not be treated as independent confirmation. MetaQuotes’ Stochastic overview.
Raw %K, slowing and a platform detail
For a lookback of N candles, raw %K = 100 × (close − lowest low)/(highest high − lowest low). If the recent high is 1.0860, the low is 1.0800 and the close is 1.0842, raw %K is 70. The close sits 70% of the way up that 60-pip range.
The settings usually include %K period, %D period and %K slowing. A slowing value of 1 leaves a fast version; 3 produces a slower main curve. %D then averages the resulting main readings using the selected method. The order of fields differs between platforms, so write the labels as well as ‘14,3,3’.
There is a subtle implementation issue: MetaQuotes’ published example slows %K by dividing the sum of close-to-low distances by the sum of high-to-low ranges across the slowing window. This need not equal an arithmetic average of the separate raw percentages when ranges differ. For an exact match, inspect the selected implementation and its zero-range convention. MetaQuotes source code.
Choose between range reversal and trend pullback
A range method looks for a recovery from a lower boundary toward the middle. A trend method might look for a temporary dip in the oscillator while the wider trend remains positive. The same crossover can belong to either framework; the surrounding price conditions determine the interpretation.
A bullish %K/%D crossover occurs when %K moves from at or below %D to above it. Leaving the lower zone means %K crosses above 20. These are separate events and may occur on different candles. If the strategy requires both, specify whether they must happen simultaneously or within a defined window.
Regular divergence compares lower price lows with higher oscillator readings, or higher price highs with lower readings. Use a fixed pivot definition and confirmation delay if testing it. This article’s range study does not add discretionary divergence requirements.
A fixed H1 range study
This educational study defines its range before looking for an oscillator signal. It has not been validated as a profitable strategy.
- At the start of a setup, use the preceding 48 completed EUR/USD H1 candles to fix range low L, range high H and midpoint M. Require range width at least four ATR14 units and the absolute EMA50 change over the last ten bars no more than 0.25 ATR14.
- Keep those boundaries fixed for the next 12 completed candles. Cancel the setup if any candle closes outside the range by more than 0.25 of the setup ATR.
- For a long trigger, require the candle low within 0.25 setup ATR either side of L and its close above L and above its own open. Require %K to cross from at or below 20 to above 20, and finish above %D on that same closed candle.
- Enter at the next available ask with spread at most 2 pips. Set the stop 0.25 setup ATR below the lower of L and the trigger low. Use M as the target and skip if target distance is less than twice actual stop distance.
- Risk no more than 0.5% of equity including costs, take one attempt per fixed range, and close any remaining position after 12 completed candles.
Set an explicit entry-slippage limit, such as 0.2 setup ATR above the trigger close. Research shorts by mirroring the rules at the upper boundary with an 80-level downward crossing.
Hypothetical EUR/USD range and trade arithmetic
Suppose the fixed range is 1.0800–1.0900, with midpoint 1.0850 and setup ATR14 of 0.0020, or 20 pips. A valid signal candle dips to 1.0798, closes at 1.0806 above its open, and %K rises from 18 to 24 while %D finishes at 22. The low is within the permitted five-pip boundary buffer.
If the next ask fill is 1.0808, the stop is 1.0793: five pips below the trigger low. Initial risk is 15 pips and the midpoint target offers 42 pips, or 2.8R before costs. This satisfies the stated minimum, unlike a late entry that substantially reduces the target distance.
With USD 10,000 equity and a USD 50 planned-risk budget, pre-cost position size is 50/(15 × 10) ≈ 0.333 standard EUR/USD lots. Fees and execution allowances reduce it. The relatively narrow stop makes those costs particularly material, so inspect the broker’s minimum stop distance and actual spread before assuming the trade is executable.
Why the oscillator can fail
A quiet range can transition into a directional move, leaving the oscillator near an extreme while a reversal position loses. In very narrow ranges, a small quote change can also cause a large percentage move in %K. A busy oscillator pane does not necessarily mean there is enough price movement to cover costs.
Test range identification and the oscillator trigger together. A backtest that decides in hindsight which periods were ranges gives the strategy knowledge unavailable at entry. Keep the fixed-boundary expiry and all rejected trades in the record.
Use chronological out-of-sample data and examine net expectancy, drawdown, trade frequency and losing sequences. Include variable spread, commission, slippage and any financing. Compare results across several parameter neighbourhoods instead of selecting a single attractive combination. Use tick data or conservative sequencing where stop and target are both touched within an hourly candle.
Match MT4 and MT5 settings explicitly
Add Stochastic Oscillator from the desktop oscillator list. For this study, enter %K period 14, %D period 3, slowing 3, Low/High price field and Simple averaging. Add horizontal levels at 20 and 80 and save the chart template.
Use the Data Window for the last completed candle’s %K and %D values. An apparent intrabar crossover may reverse before the close. If implementing the rules in an Expert Advisor, compare the last two completed readings only after a new bar begins.
When porting the setup, check field order, slowing formula, price field, averaging method, warm-up history and timezone. A custom ‘full stochastic’ or ‘slow stochastic’ label alone does not establish numerical equivalence. Validate several manually selected bars before trusting the complete backtest.
Sources and further reading
Official documentation and research checked for this update. Broker terms depend on the contracting entity and can change.