
Technical analysis · Trend
Moving Averages in Forex: SMA, EMA and a Complete Trend Framework
Moving averages compress price history into a smoother reference. They help define trend direction and organise a trading process, but their lag and sensitivity to ranging conditions remain central to their use.
A smoother view of price, with a delay
A moving average replaces a series of prices with a regularly updated average. It can make a directional move easier to describe, but it does not reveal information that was absent from those prices. Because the calculation includes earlier observations, it normally reacts after a change has begun.
The period counts candles, not a fixed amount of calendar time. A 20-period average on H1 summarises approximately 20 trading hours, while a 20-period average on a daily chart summarises 20 daily candles. Broker sessions, missing data and weekend boundaries can affect the underlying series.
Price above an average, an upward-sloping average, and a fast average above a slow one are three different definitions of trend. A useful method specifies which are required. The phrase ‘the trend is bullish’ is too vague for either a trading journal or a reproducible backtest.
SMA and EMA: the numerical difference
A simple moving average is SMA(N) = sum of the last N prices / N. Every observation inside the window receives equal weight. An exponential average updates recursively: EMA(t) = α × price(t) + (1 − α) × EMA(t−1), commonly with α = 2/(N + 1). Its earlier history decays gradually instead of dropping out at a fixed boundary. MetaQuotes describes the available averaging methods.
For three closes of 1.0800, 1.0830 and 1.0860, SMA3 is 1.0830. If an EMA3’s previous value was 1.0820, its next value using the 1.0860 close and α = 0.5 is 1.0840. The difference is a consequence of weighting and initialisation, not a disagreement about the latest price.
For a like-for-like comparison, use the same applied price, timeframe and shift. Allow adequate warm-up history for an EMA, and document its seed if implementing your own version.
Crossovers, slope and apparent support
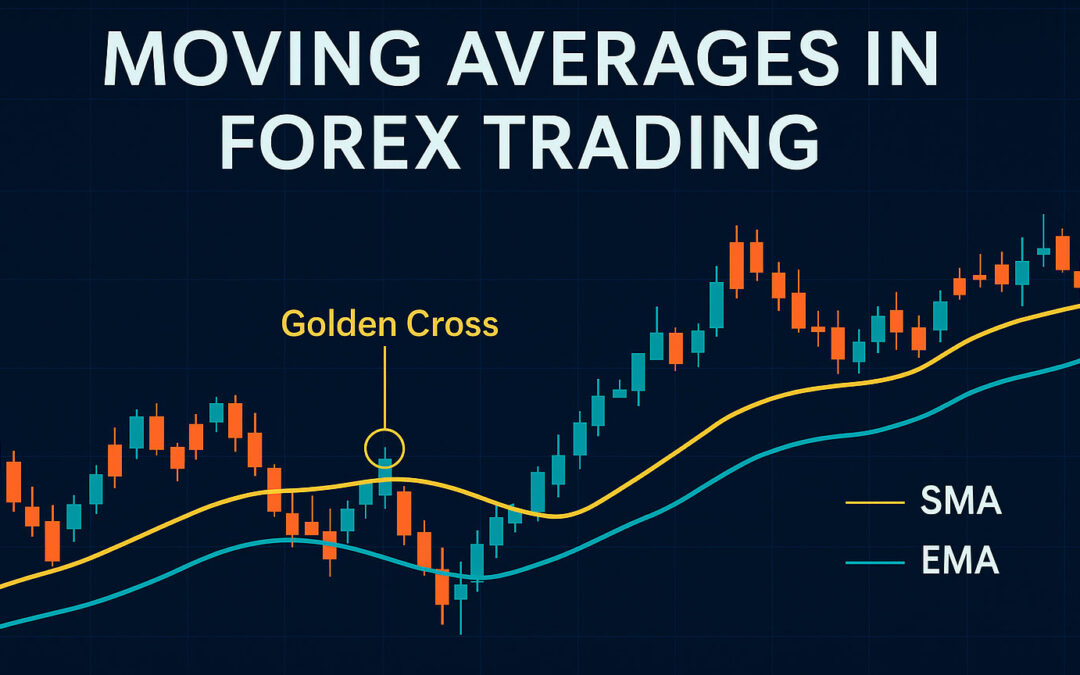
A bullish fast/slow crossover means the faster average has moved from at or below the slower average to above it. It can mark a developing trend, but it can also occur repeatedly in a flat market. Requiring upward slope may reduce some entries while delaying others. Neither the additional filter nor the faster reaction of an EMA automatically improves results.
Traders often describe an average as dynamic support or resistance when price revisits it. The line is a reference area, not a resting order or a barrier that price must respect. Use a price-defined invalidation point so the risk remains clear if the apparent support fails.
A 200-period average is a common long-horizon reference, but a rule built around it still needs testing on the chosen timeframe. There is no universally best moving-average length for all forex pairs or sessions.
A testable H4 EMA pullback specification
This study uses EUR/USD H4, EMA20 and EMA50 on closing prices with shift zero. All signals are determined after the candle closes.
- At bar t, require EMA20 above EMA50, close above EMA50, and EMA50 above its value five bars earlier.
- Require the preceding candle to have closed at or below its EMA20, while bar t closes above its EMA20 and above its own open. This defines a completed return above the faster average.
- Enter at the first available ask after bar t closes. Skip if spread exceeds 2 pips or the fill is more than 0.2 ATR(14) above the signal close.
- Set the stop below the lowest low of the five completed candles ending at t by a further 0.25 ATR. Freeze that distance when the trade opens and set a target at 2R, where R is the actual entry-to-stop price distance.
- Exit earlier at the next available bid after a candle closes below EMA50, or after 18 completed candles. Use the earliest stop, target or rule-based exit.
- Risk at most 0.5% of equity including estimated costs, hold one position, and require a fresh return below and above EMA20 before any later entry.
These parameters make the idea measurable. They are not a claim that this particular combination will generate a positive return.
A hypothetical EUR/USD trade
Assume EMA20 is 1.0900 and EMA50 is 1.0860 at the signal close. EMA50 was 1.0848 five bars earlier, the previous close was below its EMA20, and the signal candle closes at 1.0910 above its open. The trend and pullback conditions therefore pass.
If the actual ask fill is 1.0912, the five-bar low is 1.0870 and ATR14 is 0.0040, the buffer is 0.0010. The stop becomes 1.0860. Price risk is 52 pips; a 2R target is 1.1016. The wider stop is a consequence of observed price structure and volatility, not an instruction to accept a larger cash loss.
On USD 10,000 equity, a USD 50 budget and USD 10 pip value per standard EUR/USD lot imply 50/(52 × 10) ≈ 0.096 lots before costs. A 0.01 lot step would cap this at 0.09 lots before allowing for commission and slippage. Always recalculate after the actual entry price is known.
Recognise the regime that hurts the method
Sideways markets are the central challenge. Price crosses both averages repeatedly while little distance is available to pay for transaction costs. A sudden reversal can also cause a profitable-looking trend trade to give back gains before the slower exit reacts.
Adding more averages does not remove this tradeoff. A longer filter can avoid some poor trades and miss early parts of good moves. A very short average may improve the visual entry on one chart while increasing turnover and spread costs elsewhere.
Test a simple crossover model, a pullback model and a no-average price-breakout baseline under the same data and cost assumptions. Use chronological holdout data and report drawdown, average net trade, losing streaks and exposure. Check neighbouring periods to see whether the result depends on a narrow optimum. Analyse long and short trades separately and group results by market regime rather than relying only on one combined return figure.
Practical MT4/MT5 setup and execution checks
Add Moving Average twice through the desktop Indicators menu or Navigator. Set periods 20 and 50, method Exponential, applied price Close and shift 0. Give the fast and slow lines distinct colours and save a template. A positive chart shift is a display displacement; it does not turn an average into a forecast.
For a closed-bar test, compare the indicator with the price from the same completed candle. Reading today’s average against yesterday’s close accidentally changes the strategy. In an Expert Advisor, inspect the last closed bar after the next bar begins and ensure the history has loaded.
Use historical spreads, commission, overnight financing and realistic execution. Stops may fill beyond their requested price during gaps. When an exit is triggered by a candle close, model the next quote rather than granting a perfect historical close. Check margin separately: a sufficiently small planned stop loss does not by itself ensure an order meets margin requirements.
Sources and further reading
Official documentation and research checked for this update. Broker terms depend on the contracting entity and can change.