
Technical analysis · Momentum
MACD for Forex: Crossovers, Divergence and MetaTrader Differences
MACD compares a faster and a slower exponential average. Crossovers describe a change in their relationship, while divergence describes a mismatch between price swings and momentum. Neither supplies a stand-alone forecast.
Separate the main line, signal and zero line
Moving Average Convergence Divergence, usually shortened to MACD, describes the separation between two exponential moving averages. When the faster average is above the slower one, MACD is positive; when it is below, MACD is negative. A signal average smooths this difference so changes in momentum can be compared over time.
A main-line crossover above the signal can occur while both remain below zero. That means the faster average is still below the slower average even though their relationship is improving. It is a different event from a zero-line crossover. Conflating these two conditions makes chart explanations and backtests inconsistent.
MACD is expressed in the price units of its instrument. A value of 0.0010 on EUR/USD is a ten-pip EMA separation. It is not equivalent to a reading of 0.0010 on every currency pair, and the indicator has no universal overbought or oversold boundaries.
The formula and the MetaTrader histogram distinction
With the common settings, MACD = EMA(close, 12) − EMA(close, 26). In the native MetaTrader implementation, signal = SMA(MACD, 9). Some other implementations use an EMA signal instead, so matching the numbers 12, 26 and 9 alone does not guarantee matching signals. MetaQuotes specifies the SMA signal.
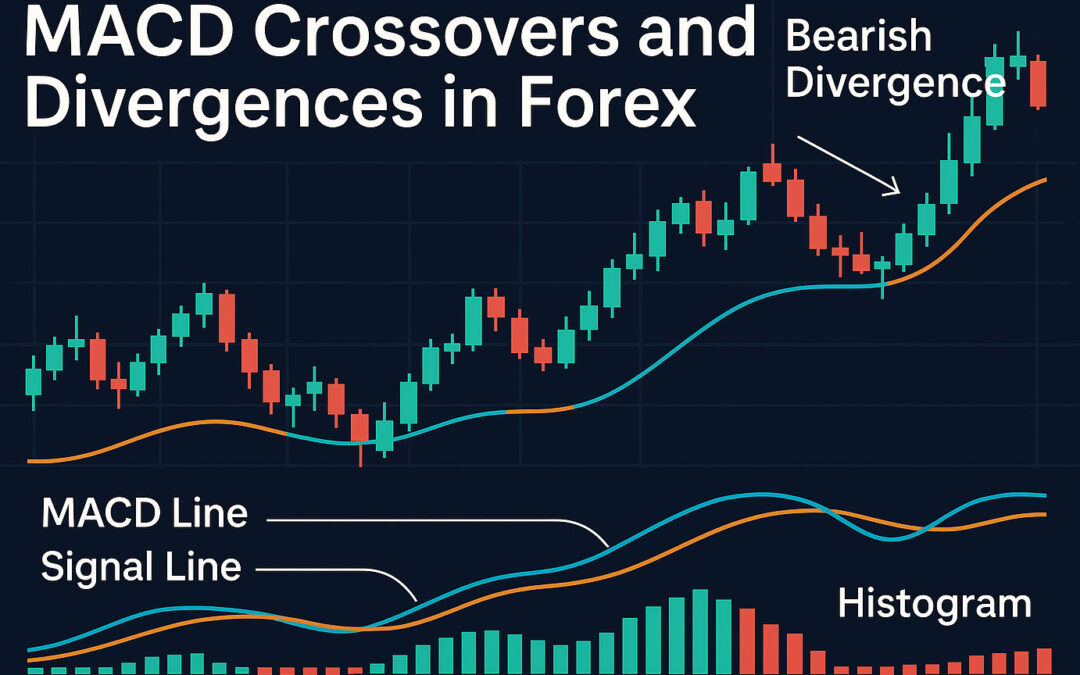
Another frequent source of confusion is the word histogram. Native MetaTrader draws the main MACD value as bars. In many other charting systems, the histogram instead represents MACD − signal. MetaTrader calls that difference the Moving Average of Oscillator, or OsMA. Therefore a native MACD bar crossing zero and an OsMA bar crossing zero are different events. Official iMACD documentation explains the display convention.
Always label which quantity appears in an illustration. A change in histogram colour in a custom indicator may describe slope rather than either type of crossover.
Use divergence as a observation that needs confirmation
A regular bullish divergence compares two price lows: price makes a lower low while the chosen momentum measurement makes a higher low. A regular bearish divergence compares higher price highs with lower momentum highs. Specify whether the measurement is the main MACD or MACD minus signal; they can identify different events.
For reproducible research, define pivots as highs or lows exceeding the corresponding values of two candles on either side. The later pivot becomes usable only after its two following candles close. Compare the MACD readings at those same price-pivot timestamps. Comparing unrelated visual peaks makes the test subjective.
Divergence may occur several times before a trend reverses, and slowing upward momentum can coexist with rising prices. Treat it as a prompt to examine structure, risk and the existing position rather than an automatic instruction to trade against the trend.
A complete H4 trend-pullback study
Here is one fixed educational specification. It deliberately uses a crossover and trend filter; divergence is not an additional discretionary entry requirement.
- Use EUR/USD H4, native MACD (12, 26, 9) on closes, and EMA100 with shift zero. Evaluate completed candles only.
- At the signal close t, require close(t) above EMA100(t) and EMA100(t) above EMA100(t−5). Require main MACD(t−1) at or below its signal and main MACD(t) above its signal.
- Require main MACD(t) below zero to identify a pullback within the separately defined broader trend. If it is already positive, this particular study takes no trade.
- Enter at the next available ask. Skip if spread exceeds 2 pips or the ask is more than 0.2 ATR(14) above the signal close. Set a stop 0.25 ATR below the lowest low of the five candles ending at t.
- Fix a target at twice the actual entry-to-stop distance. Exit earlier at the next quote following a completed bearish MACD signal-line crossover, a close below EMA100, or 18 completed H4 candles. Apply the first exit reached.
- Allow one position and risk no more than 0.5% of equity including estimated transaction costs. Do not widen the stop after entry.
Every cutoff is a research choice. Keep it fixed when testing and define the mirrored short version separately.
A numerical crossover and position-size example
Suppose EUR/USD EMA12 is 1.0818 and EMA26 is 1.0824 at the signal close. Main MACD is −0.0006, or −6 pips. If its signal value is −0.0008, main minus signal is +0.0002. MACD is above its signal while still below zero; native MACD bars remain negative, whereas an OsMA histogram is positive.
Assume the previous candle had main MACD −0.0009 and signal −0.0008. That makes the latest change a completed bullish signal crossover. If all other rules pass and a hypothetical long fills at 1.0830 with a stop at 1.0790, price risk is 40 pips and a 2R target is 1.0910.
A USD 10,000 account with a 0.5% planned-risk cap provides USD 50. At USD 10 per pip per standard EUR/USD lot, 0.125 lots is the maximum before costs. Reduce that amount for commission and an execution allowance, then round down to the broker’s volume increment. A gap can still create a loss beyond the planned amount.
Where MACD struggles and how to test it
In a narrow range, small price changes can repeatedly reverse the fast/slow relationship. Trading every crossover then accumulates spread and commission. After a sudden announcement, the averages may confirm a move only after much of it is complete. A late crossover is mathematically normal for an indicator built from averages.
Test the entire rule set against a simpler trend-only baseline to see whether MACD adds value. Use a chronological split, reserve later data, and include warm-up history before the first evaluated trade. Compare results across several market regimes without selecting pairs solely because they performed well in hindsight.
Inspect net expectancy, drawdown, losing streaks, trade count and exposure time. Model bid/ask execution, changing spread, commissions, financing and slippage; a bar-close decision cannot fill retrospectively at that exact close. If a stop and target share a candle, resolve the order with suitable tick data or a documented conservative assumption. Any rule changed after viewing the holdout period requires a new independent evaluation.
Implement consistently in MT4 and MT5
Add native MACD from the desktop indicator list and select fast EMA 12, slow EMA 26, signal 9 and Close as the price input. Use the Data Window to identify the main and signal values on a completed candle. Add EMA100 separately and keep its chart shift at zero.
If coding in MT5, iMACD exposes buffer 0 for the main value and buffer 1 for the signal. Check buffer timestamps and data readiness before comparing the last two closed bars. A chart screenshot from another platform is not sufficient validation of a custom implementation.
Save the platform build, parameters, timeframe, broker data feed and signal definition with each test. That record is particularly useful when moving a strategy between MT4, MT5 and another charting package.
Sources and further reading
Official documentation and research checked for this update. Broker terms depend on the contracting entity and can change.