
Technical analysis · Market structure
Fibonacci Retracements for Forex: Anchors, Levels and Trade Planning
Fibonacci retracements are a way to organise a known price swing into reference levels. Their usefulness depends on reproducible swing selection and independent price confirmation; the ratios do not establish a probability of reversal.
A price map built from two anchors
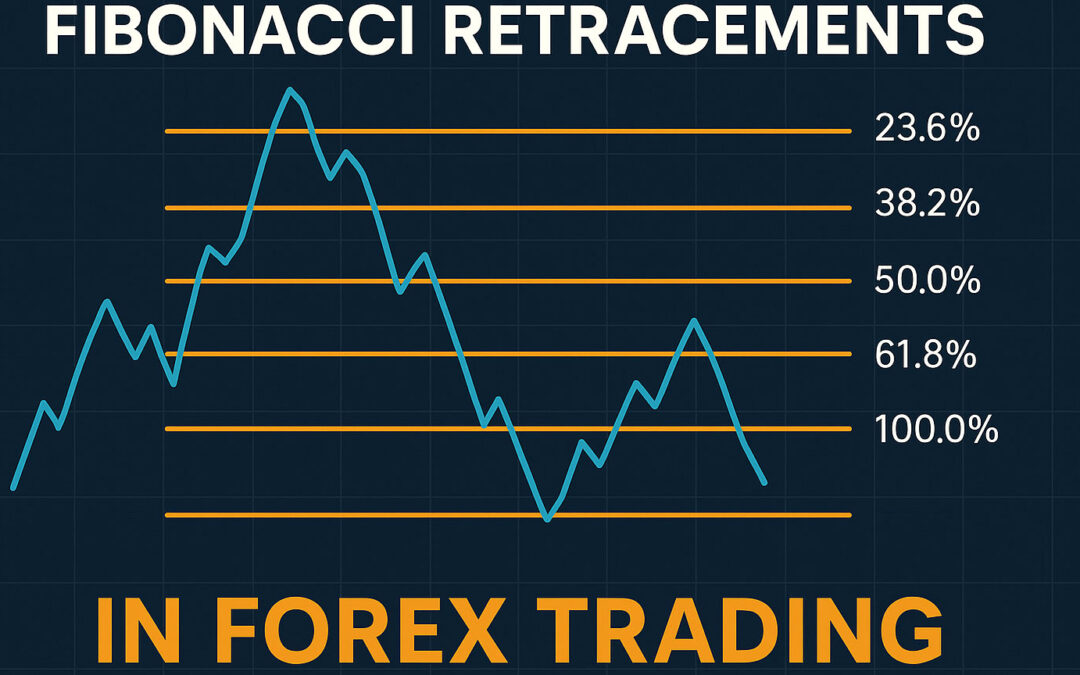
A retracement measures how much of an earlier directional move has been given back. Once a low and a high are selected, Fibonacci tools draw horizontal levels at specified fractions of the distance between them. They do not analyse order flow, calculate the chance of a bounce or identify the correct swing automatically.
The familiar 38.2% and 61.8% ratios relate to the Fibonacci sequence; 78.6% is approximately the square root of 61.8%. The frequently displayed 50% level is a midpoint convention, not a Fibonacci ratio. Including it can be useful as a neutral reference, provided it is labelled correctly.
MetaTrader offers both retracement and expansion objects. A retracement divides a two-point swing; a three-point expansion projects a distance from a later pullback point. Their labels are not interchangeable. See the official Fibonacci tool definitions.
Calculate the prices before drawing the labels
For an upward move from low A to high B, the price after a retracement fraction r is B − r(B − A). For a downward move from high A to low B, it is B + r(A − B). Both equations measure the pullback from the ending point toward the origin.
Suppose EUR/USD rises from 1.0800 to 1.1000, a distance of 200 pips. A 38.2% retracement is 1.09236, the 50% midpoint is 1.09000, the 61.8% retracement is 1.08764, and a 78.6% retracement is 1.08428. A full 100% retracement returns to 1.0800. Those prices follow directly from the chosen anchors; another swing produces another map.
Chart packages can reverse the visible 0 and 100 labels depending on drawing direction. Verify the actual midpoint and 61.8% price rather than trusting the orientation. Round levels to the instrument’s valid tick size before using them in an order.
Remove hindsight from swing selection
The biggest practical weakness is choosing a swing because its ratios fit a reversal you already know happened. A reproducible method must say when an anchor becomes known. For example, define a pivot low as a candle whose low is strictly below the lows of the two candles before it and the two after it. The pivot is only confirmed after those two later candles close.
For this study, take the latest confirmed pivot high and its immediately preceding confirmed pivot low, requiring the high to follow the low and the resulting rise to exceed three ATR(14) units measured at high confirmation. Freeze the anchors then. If the first qualifying pullback happened before that confirmation, it was unavailable to this strategy.
Reject equal-price ties under this definition. Do not redraw an anchor after entry to preserve an attractive narrative. Record the broker’s candle timezone because a different H4 boundary can change which pivot exists.
A closed-bar pullback framework to research
Use EUR/USD H4 and the fixed upward swing definition above. This is a hypothetical strategy specification, not evidence of profitability.
- At anchor confirmation, require the closing price above EMA50 and EMA50 above its value five completed bars earlier. Define the pullback zone between the 50% and 61.8% prices.
- Within the next ten completed bars, wait for the first candle whose range intersects that zone and whose close is above the 50% level and above its own open.
- Cancel the setup if a candle closes below the 78.6% price before entry. If ten bars pass without a trigger, discard the swing.
- Enter long at the next available ask after the trigger closes, provided spread is at most 2 pips and the fill is no more than 0.2 ATR above the signal close.
- Set the stop 0.25 ATR below the lower of the trigger low and the 78.6% price. Freeze ATR at the signal close. Use the original high as the target and skip if its distance from the actual fill is less than twice the stop distance.
- Risk at most 0.5% of current equity including estimated costs. Allow one attempt per swing, one position at a time, and close any remainder after 12 completed H4 bars.
For a short-side test, reverse the swing direction and every entry, cancellation and exit condition before collecting results.
Turn the map into an actual risk calculation
Using the 1.0800–1.1000 swing, suppose the first valid rejection candle trades into the zone and closes at 1.0908. The next executable ask is 1.0910. Assume the stop formula produces 1.0835. The risk is 75 pips, while the target at 1.1000 offers 90 pips, giving only 1.2R before costs.
The stated framework skips this trade. A convincing-looking 61.8% reaction does not override the reward-to-risk requirement. Worked examples should include such rejected signals: otherwise they hide one of the most useful functions of a complete trading plan.
If a different, independently valid setup had a 40-pip stop and 90-pip target, the gross ratio would be 2.25R. With a USD 50 budget and a USD 10 pip value per standard lot, the pre-cost size would be 0.125 lots. Actual permitted size must be lower after fees and a realistic execution allowance.
Confluence, failure and evidence
A prior horizontal turning area near a retracement can be a reason to study the zone, but several price-derived lines agreeing does not create independent statistical evidence. A 50% level and a moving average may overlap by chance. List confluence requirements in advance and compare performance with and without each one.
Ratios frequently fail when the earlier swing was a temporary reaction, a fresh policy announcement changes the market, or volatility expands. There is no obligation for price to stop at any level. A retracement that reaches the origin may simply be a reversal of the original move.
Backtest chronologically with delayed pivot confirmation, untouched later data, commission, spread, slippage and financing. Save rejected setups as well as trades. Compare the chosen zone against a plain 40–60% pullback or previous-swing support benchmark. The question is whether the specific ratios add value after costs, not whether historical charts contain examples that resemble them.
Use the drawing object in MT4 and MT5
On MT5 desktop, open Insert → Objects → Fibonacci → Retracement. MT4 provides Fibonacci retracement among its drawing tools. Place the endpoints on the selected swing, then inspect the object’s coordinates and level properties. Add or remove levels to match the research plan rather than covering the chart with every available percentage.
MetaTrader allows level descriptions and precise anchor coordinates; check these against your hand calculation. Official retracement object instructions.
Use a separate colour for the pullback zone, the invalidation level and the target. Keep the original anchors in your journal. An automatic Fibonacci add-on should be checked for pivot repainting and whether it changes historical anchors after later highs or lows appear. A beautifully fitted historical overlay may not reproduce what a trader actually saw.
Sources and further reading
Official documentation and research checked for this update. Broker terms depend on the contracting entity and can change.