
Technical analysis · Momentum
RSI for Forex: Momentum, Divergence and Rules Beyond 70/30
RSI compares smoothed upward and downward price changes on a 0–100 scale. Extreme readings describe recent momentum; they do not mean a currency is mispriced or required to reverse.
What relative strength means here
The Relative Strength Index measures the balance of positive and negative price changes within one instrument. It does not compare the euro with a basket of currencies, and it is not a valuation measure. Its name can otherwise be confused with relative performance or currency-strength dashboards.
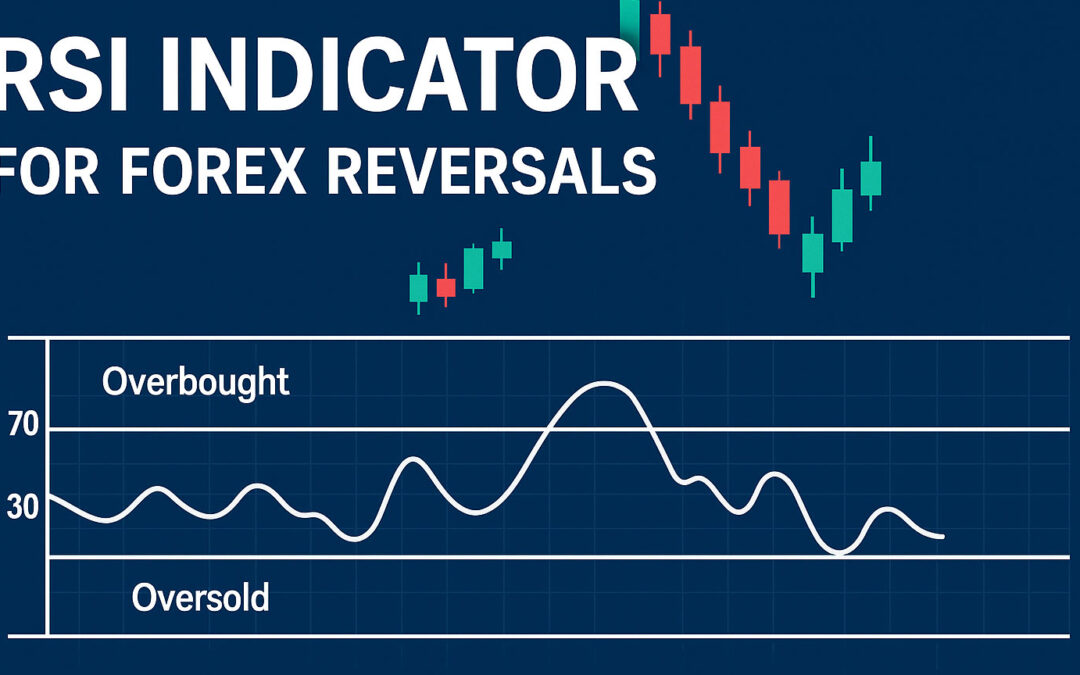
A reading above 70 is commonly called overbought and below 30 oversold. Those labels describe strong recent upward or downward momentum. They do not imply that buyers or sellers are exhausted. A persistent trend can hold the oscillator near an extreme while price continues in the same direction.
The 50 line is a useful neutral reference for the balance between smoothed gains and losses. A move through it is different from leaving an extreme. Decide whether the study aims to follow momentum or fade a range before interpreting the same RSI reading as a trade signal. MetaQuotes’ RSI reference.
Calculate gains, losses and Wilder smoothing
For each close-to-close change Δ, define gain G = max(Δ, 0) and loss L = max(−Δ, 0). These are price magnitudes, not counts of up and down candles. Seed the average gain and loss with the arithmetic mean of N changes. Thereafter, Wilder smoothing updates each average as new average = [(N − 1) × previous average + latest observation]/N.
Let RS = average gain / average loss. Then RSI = 100 − 100/(1 + RS). With average gains of 6 pips and average losses of 4 pips, RS = 1.5 and RSI = 60. This says nothing about the number of consecutive winning trades a strategy should achieve.
If average loss is zero but average gain is positive, the limiting value is 100; with only losses it is 0. A completely flat series needs an explicit implementation convention. Verify seed and zero handling when comparing custom calculations. MetaQuotes publishes RSI source code for inspection.
Divergence and failure swings without hindsight
A regular bullish divergence occurs when price makes a lower low but RSI at that later low is higher. A bearish divergence pairs a higher price high with a lower RSI reading. Either describes a mismatch in momentum; neither proves that price must turn immediately.
For objective comparisons, define price pivots using two lower highs or higher lows on each side, and wait for the two confirming candles. Measure RSI at the same price-pivot timestamps. Mark the confirmation date separately from the pivot date so a historical chart does not imply the signal was available earlier.
A bullish failure-swing study can instead track RSI falling below 30, recovering, holding above 30 on a later dip, then exceeding the prior RSI recovery high. That is a separate pattern requiring its own exact pivot rules. Do not add whichever pattern happens to justify the trade currently on screen.
A closed-bar RSI trend-pullback study
The following educational specification uses EUR/USD H4, RSI14 and EMA50 of closes. Its thresholds are research choices, not optimised recommendations.
- At the signal close t, require price above EMA50 and EMA50 above its value five candles earlier.
- Require RSI(t−1) at or below 40 and RSI(t) above 40. Require RSI to have remained at or above 30 throughout bars t−4 through t. This defines a moderate pullback rather than any oversold reversal.
- Require the signal candle to close above its own open. Enter at the next available ask, provided spread is at most 2 pips and the fill is no more than 0.2 ATR(14) above the signal close.
- Place the stop 0.25 ATR below the lowest low of the five candles ending at t. Freeze the initial stop and set a target at twice the actual entry-to-stop distance.
- Exit earlier at the next quote after RSI crosses from at or above 40 to below 40, after a candle closes below EMA50, or after 18 completed H4 candles. Apply the first available exit.
- Use a maximum planned loss of 0.5% of equity including costs, allow one position, and require a fresh qualifying RSI reset before another entry.
Mirror the long-side logic around 50 for a separately specified short study, including levels of 60 and 70 and the opposite price filter.
Worked RSI signal and risk example
Suppose RSI14 moves from 38.5 on the previous completed candle to 43.0 on the latest one, after a five-bar minimum of 34.0. EUR/USD closes above a rising EMA50 and above its open. Those facts satisfy the study’s signal conditions; a temporary intrabar reading of 43 would not.
Assume entry at 1.0905, a five-bar low of 1.0875 and ATR14 of 0.0040. The 0.25 ATR buffer is 10 pips, putting the stop at 1.0865. Initial risk is 40 pips and the 2R target is 1.0985.
For USD 10,000 equity and a 0.5% risk budget, planned loss is USD 50. At USD 10 per pip for a standard EUR/USD lot, the pre-cost calculation is 0.125 lots. Commission and an execution allowance reduce the permitted amount; round down to the broker’s step. RSI does not enter the position-size formula. It provides the trigger, while price distance and contract specifications determine the exposure.
Limitations and useful validation
RSI can remain below 30 during a sell-off, repeatedly cross 50 in a range, and show divergence well before a directional change. A longer period smooths some variation at the cost of delay. A shorter period produces faster changes and potentially more trading costs.
Compare the proposed trigger with a simple price pullback using the same trend filter and exits. That helps reveal whether RSI contributes useful information rather than merely making the chart look more convincing. Test chronological development and holdout periods, retain failed setups, and include several volatility regimes.
Report net expectancy, trade count, drawdown and consecutive losses. Model historical spreads, round-trip commission, slippage and swap charges. Decide scheduled-news exclusions before testing. If a single candle includes both stop and target, use suitable tick data or a conservative sequence assumption. One screenshot showing a successful reversal cannot establish a robust method.
Configure RSI in MT4 and MT5
Add Relative Strength Index from the desktop oscillator list, set period 14 and applied price Close, and display 30, 50 and 70. For the research framework, add 40 as a separate reference. Use the Data Window to inspect completed-bar values and keep the price chart visible above the oscillator.
When reproducing a test in another platform, check Wilder smoothing, initialisation history, candle timezone and the applied price. An RSI using a simple rolling average of gains and losses is a different implementation even when both panels say ’14’.
Save chart templates and record the exact closed-bar readings at each decision. Custom divergence tools deserve extra inspection: if later candles relocate historical arrows, a visually clean history may include information that was unavailable at the time.
Sources and further reading
Official documentation and research checked for this update. Broker terms depend on the contracting entity and can change.