
See the same market logic used by the trading assistants
Two clear, editable indicators mark completed-candle setups for a trend-breakout approach and a filtered range approach. They never place trades and are intended for chart study, alerts and strategy validation.
Includes editable .mq5 source and compiled .ex5 files · MetaEditor: 0 errors, 0 warnings
TF Donchian ATR Channel
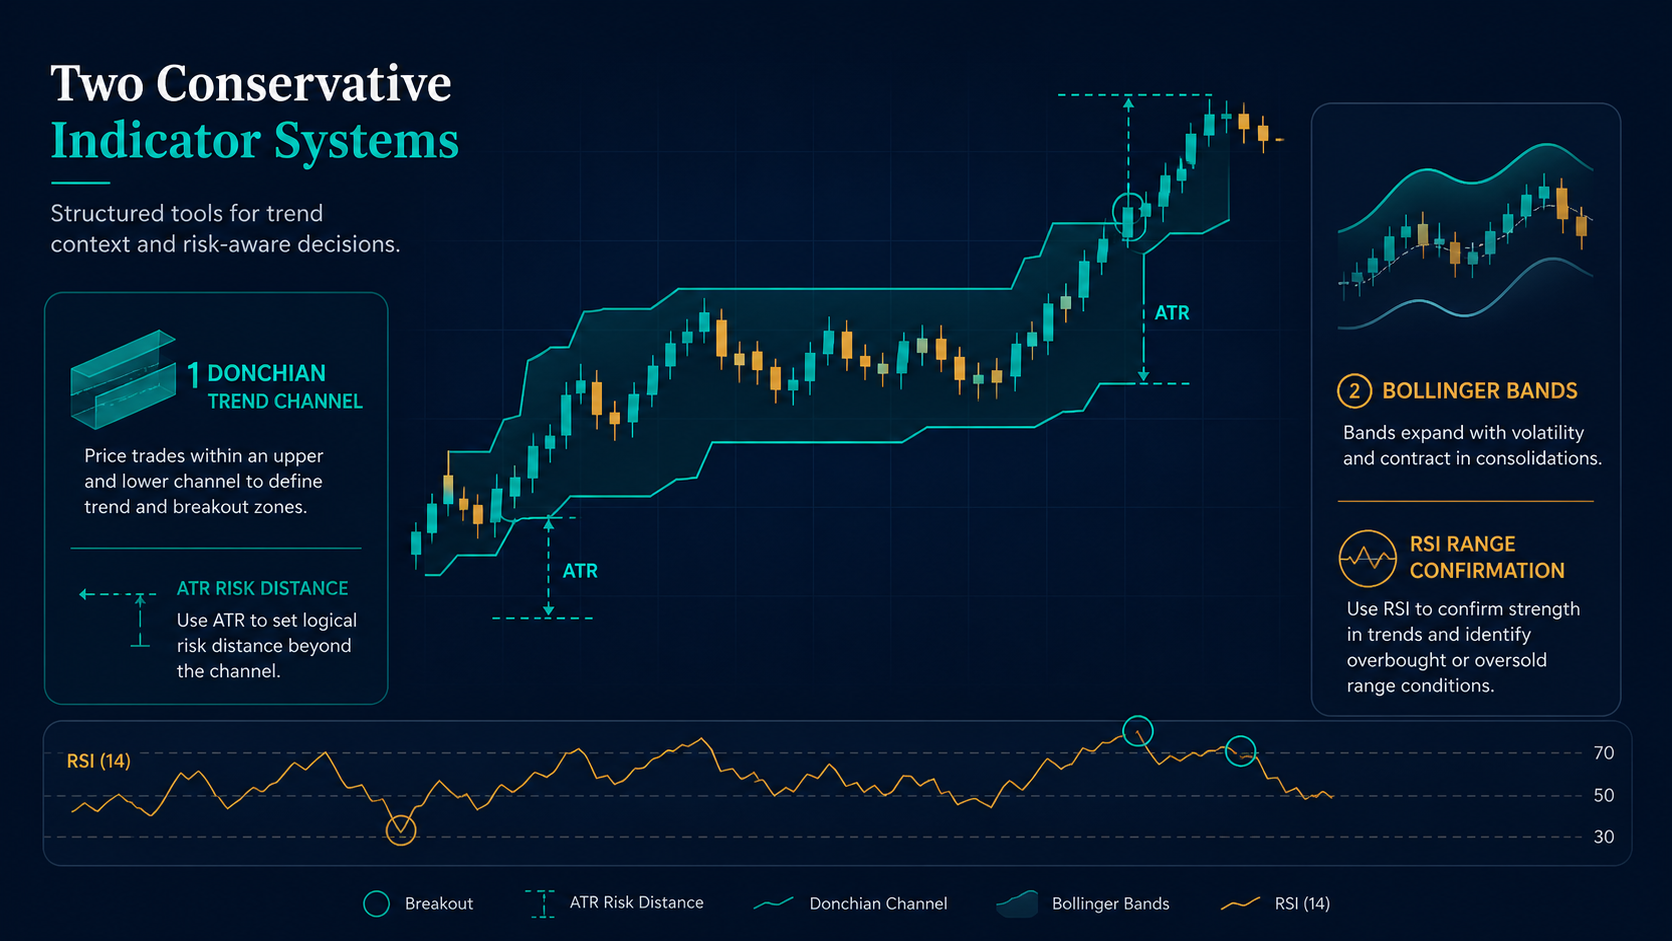
The indicator draws the previous 55-bar Donchian high and low, a 200-period EMA direction filter and optional ATR reference-stop dots. An arrow appears only after a candle closes beyond the channel in the direction of the EMA.
- Suggested companion timeframe: H4
- Default channel: 55 completed bars
- Default filter: EMA 200
- Reference stop: 2.2 × ATR(14)
Identifying infrequent breakouts, studying trend persistence and checking whether a Donchian signal aligns with a long-term direction filter.
Main weakness
Sideways markets can create repeated false breakouts and transaction costs may dominate.
TF Bollinger RSI Range
The indicator looks for a candle that closed outside a Bollinger Band followed by a completed close back inside. The prior candle must have an RSI extreme, and ADX must remain below the selected maximum.
- Suggested companion timeframe: H1
- Bollinger Bands: 20 periods, 2 deviations
- RSI: 14 with 30/70 extremes
- ADX: 14, maximum 22
Studying possible range re-entry after an extension and filtering out some signals during stronger trends.
Main weakness
Mean reversion can fail sharply when a genuine trend begins or volatility expands.
How to validate an indicator
1. Define the market: decide the symbols, sessions and timeframe before reviewing results.
2. Include costs: an attractive chart marker may have little value after spread, commission and slippage.
3. Separate samples: tune on one period and evaluate on a later, untouched period.
4. Forward-observe: compare live demo signals with the history before relying on the logic.
Add the indicators to MT5
- Download and unzip the pack.
- In MT5 choose File → Open Data Folder.
- Copy .mq5 or .ex5 files to MQL5/Indicators/Trade-Forex/.
- Compile .mq5 files in MetaEditor if you want to inspect or modify the source.
- Refresh Navigator and drag an indicator onto a chart.
- Use the matching H4 or H1 defaults as a starting point—not a universal optimum.
Official references
Educational charting tools only—not trading advice. Version 1.00 · September 2026.