
Indicators for MT5
Free custom indicators for desktop MetaTrader 5. Choose a tool by function, then review its rules, inputs and limitations before downloading its source code and compiled MT5 file.
Start with a built-in or custom MT5 indicator
For built-in tools such as Moving Average, RSI or MACD, open MT5’s Navigator, expand Indicators and drag the tool onto a chart. These platform indicators do not need a ZIP from this library. MetaQuotes explains the built-in controls.
Can I install these MT5 indicators on Android or iPhone?
No. These custom .mq5/.ex5 downloads run in the desktop MT5 terminal, not inside the native Android or iPhone app. On a phone, use the app’s built-in indicators instead; MetaQuotes documents the mobile controls. Logging into the same trading account on a phone does not transfer a custom desktop indicator to the mobile chart.
The downloads below are custom indicators. Choose the information you want to inspect:
- Trend context: TF EMA Trend Context displays the 50/200 EMA relationship and completed-bar crossover markers.
- Volatility and risk distances: TF ATR Risk Bands plots adjustable ATR reference distances; it does not place stops or calculate lots.
- Relative currency strength: TF Currency Network Strength compares eight currency scores from broker history; a high score is not a price forecast.
- Breakout levels: TF Donchian ATR Channel shows channel levels and completed-bar breakout markers with EMA direction context.
- Range and re-entry context: TF Bollinger RSI Range combines Bollinger re-entry markers, an earlier RSI extreme and an ADX range filter.
Open the selected tool’s documentation before using its Download ZIP card. Then follow the MT5 indicator installation guide, keeping that package’s own inputs and dependencies. Choose by function, not an assumed trading return. An existing compatible account can be used.
Need a compatible account? Compare broker eligibility, platforms and costs before choosing.
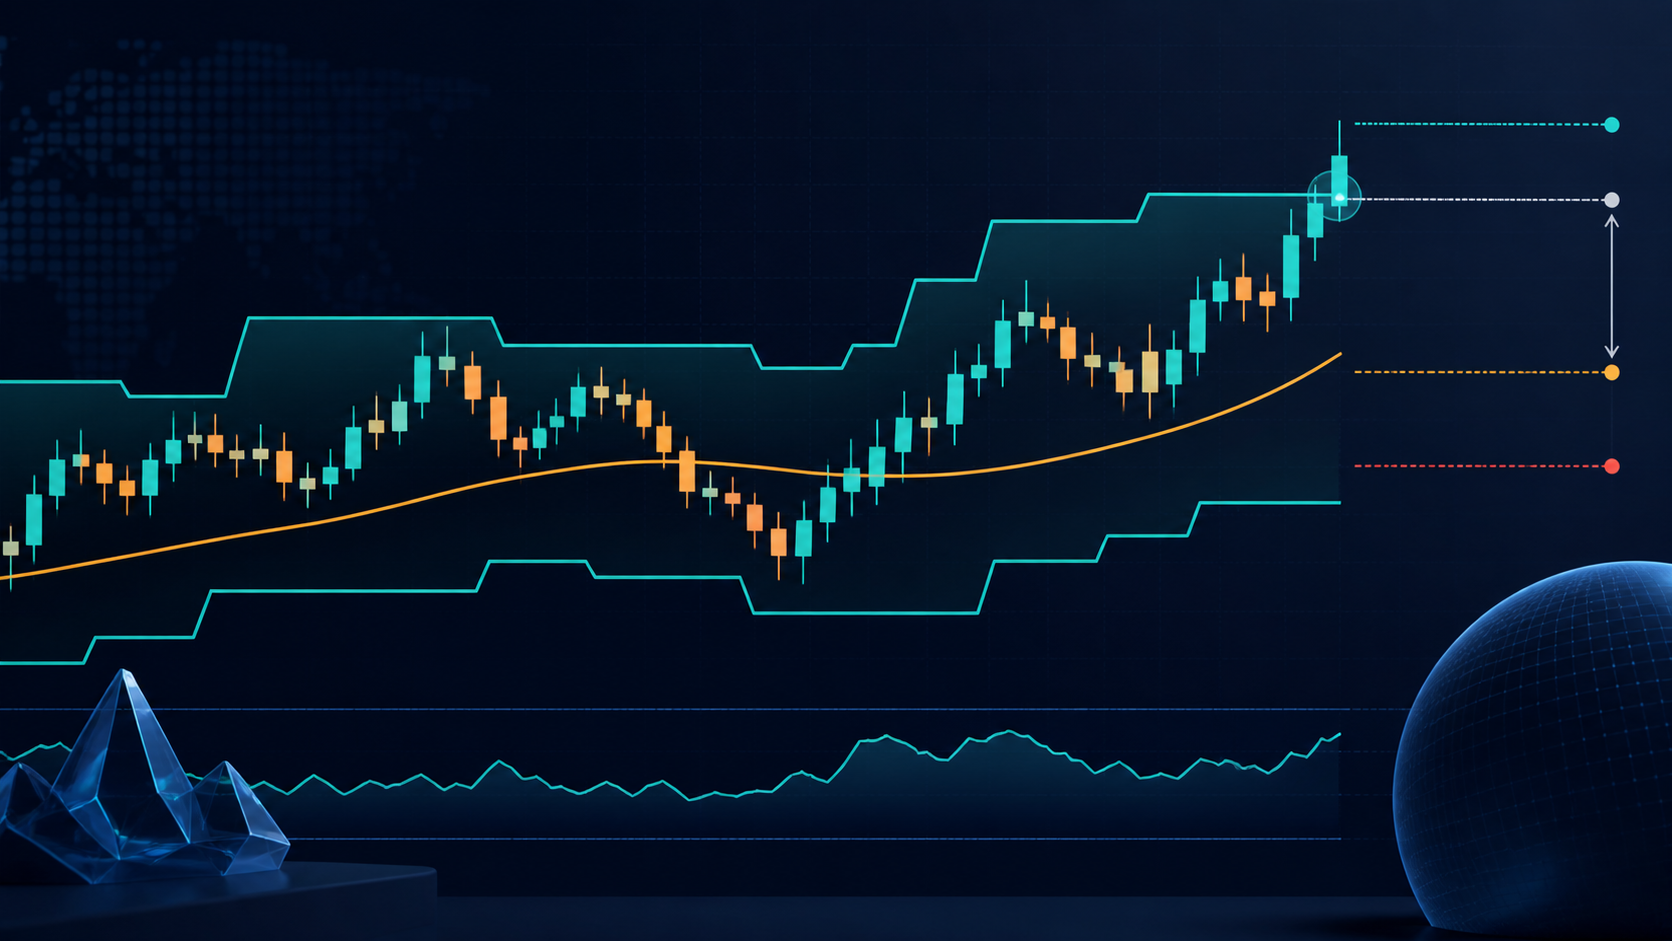
TF Donchian ATR Channel
Donchian channel, EMA direction, completed-bar breakout markers and optional ATR reference stops.
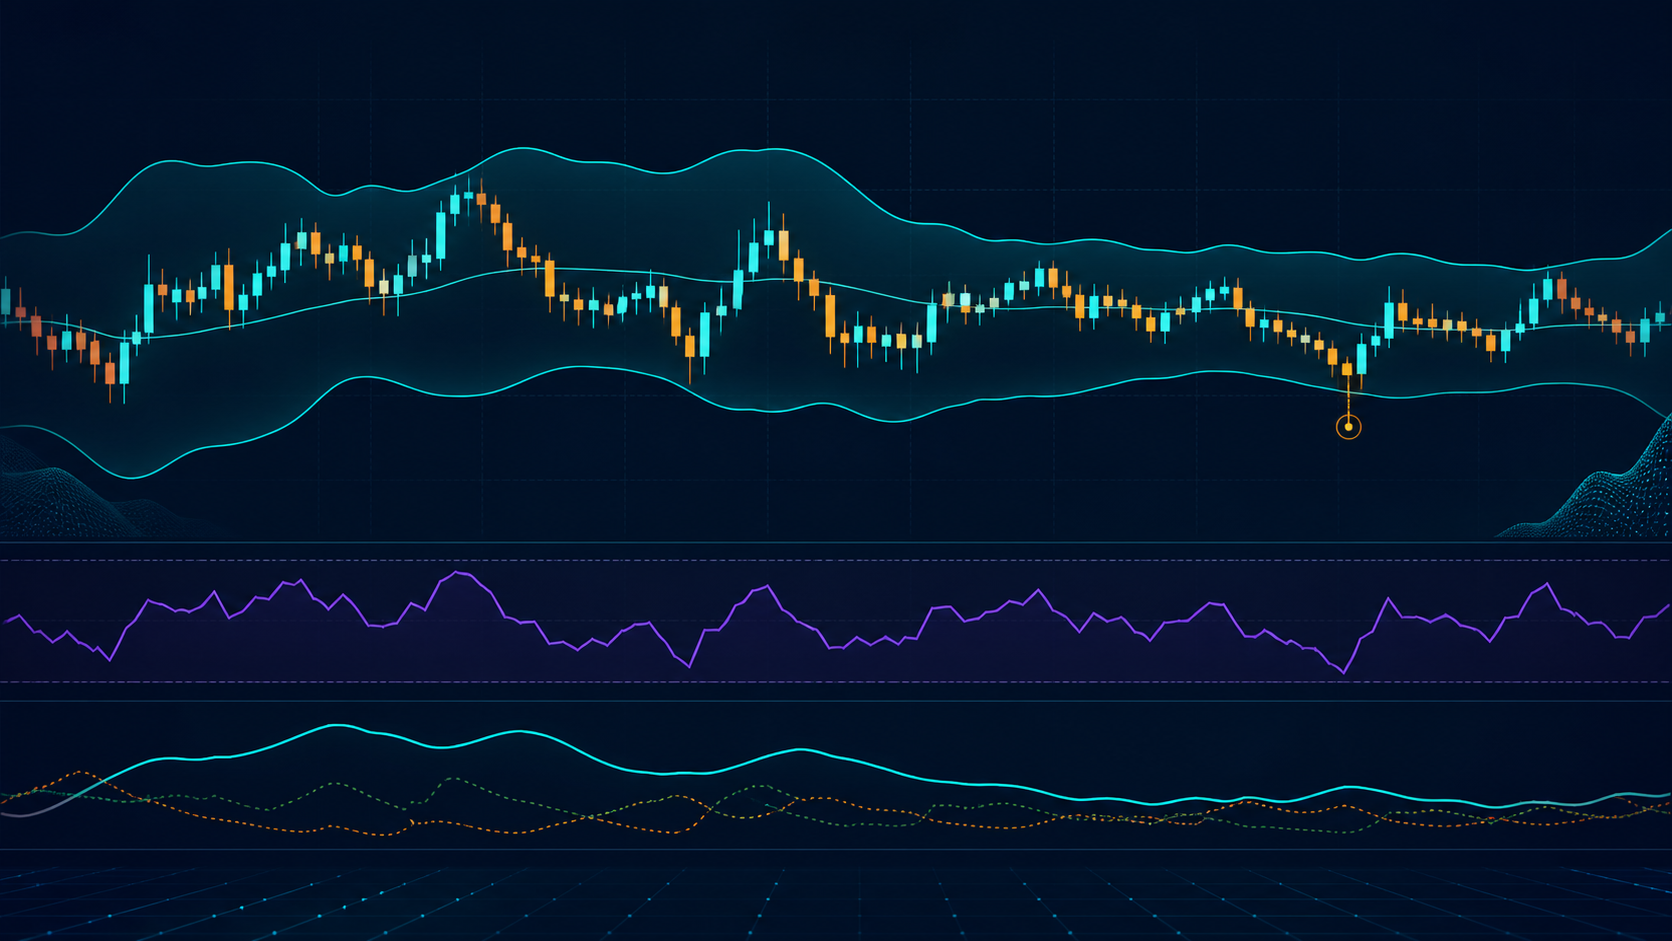
TF Bollinger RSI Range
Bollinger re-entry markers filtered by a prior RSI extreme and a low-ADX range condition.

TF EMA Trend Context
A clean 50/200 EMA overlay with completed-bar bullish and bearish crossover markers.
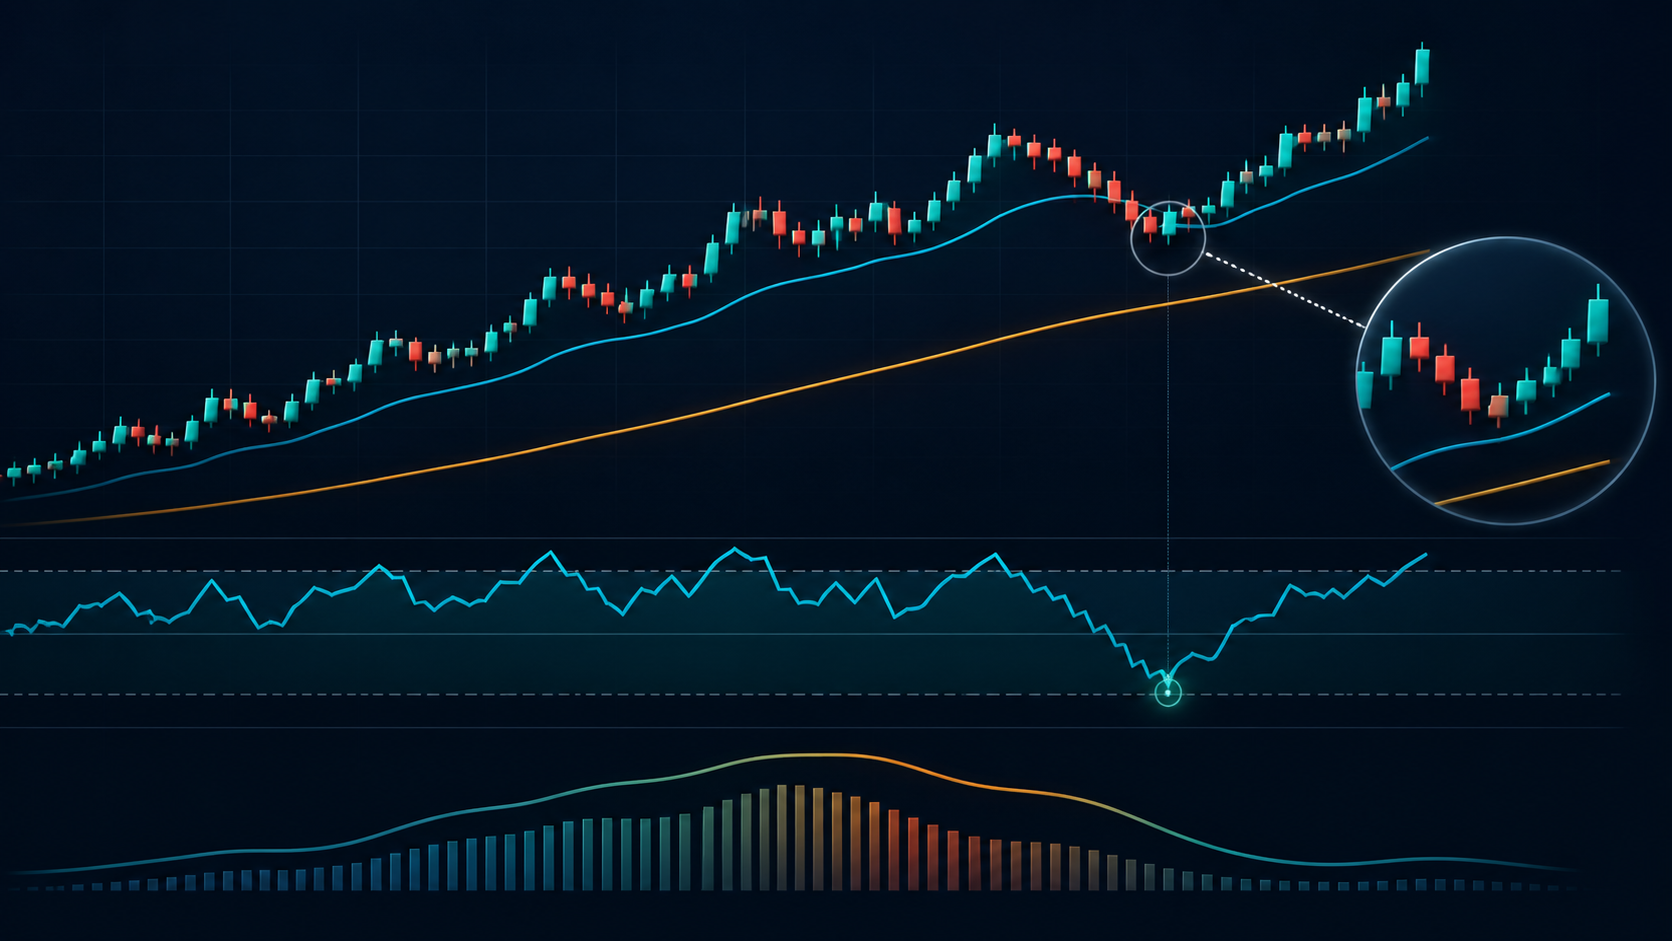
TF RSI Trend Pullback
Completed RSI recovery markers accepted only in the EMA 200 direction and with minimum ADX strength.
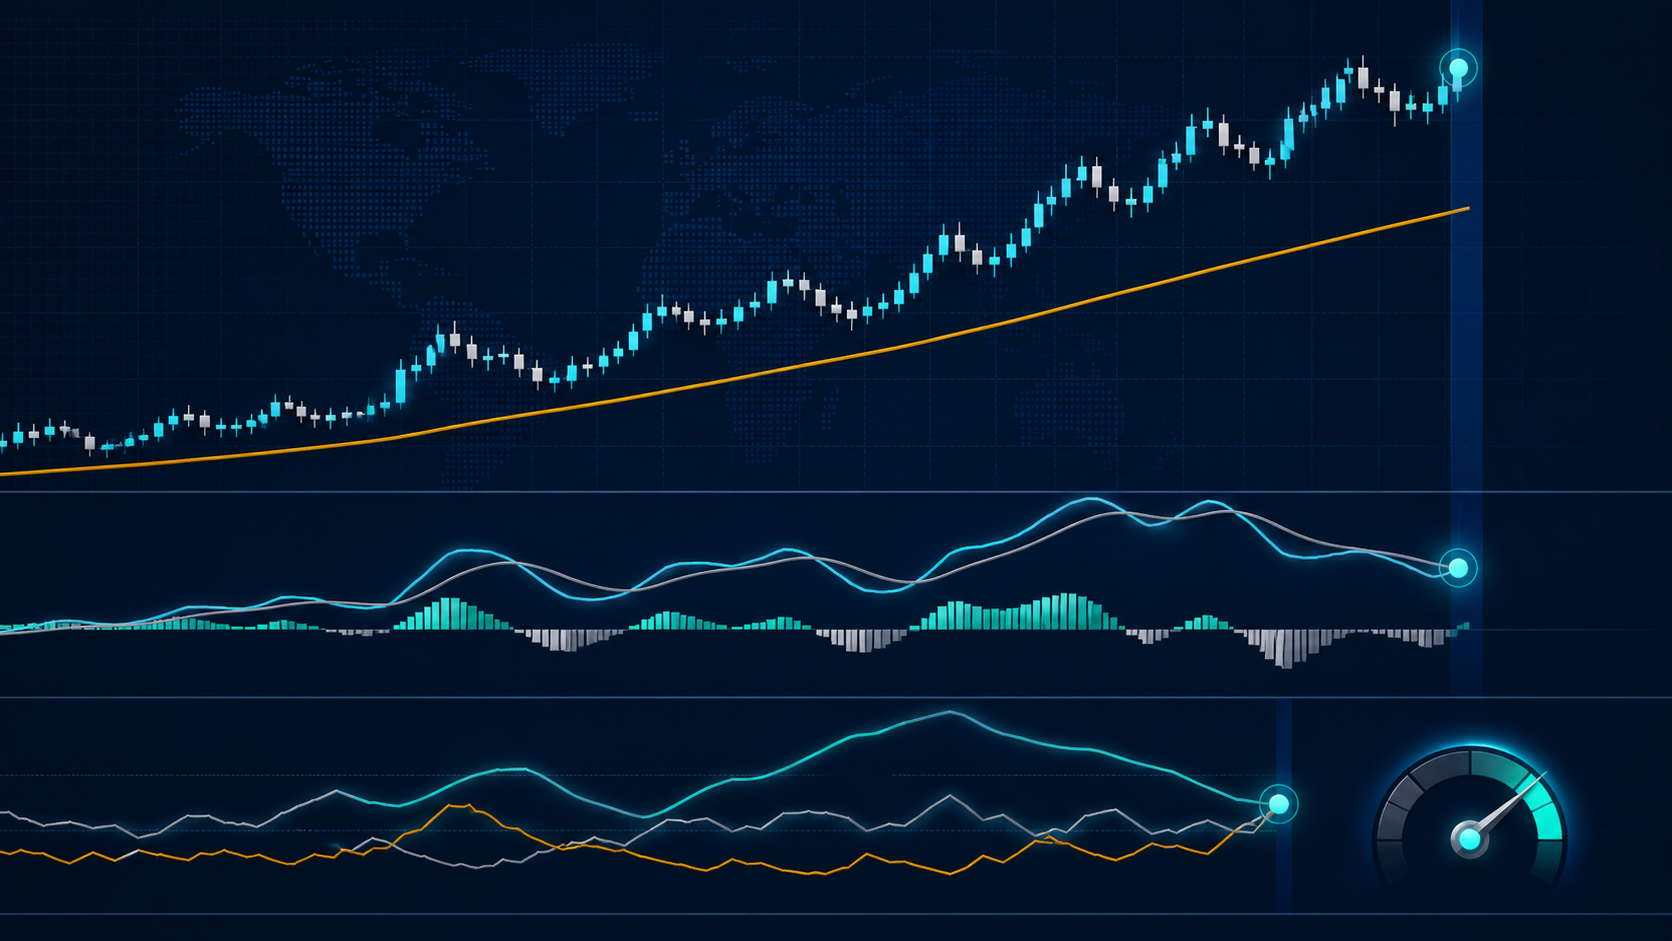
TF MACD ADX Trend
Completed MACD signal-line crosses filtered by EMA 200 direction and ADX trend strength.

TF ATR Risk Bands
Four volatility-scaled bands showing configurable stop- and target-distance references around price.

TF Currency Network Strength
Robust weighted least-squares decomposition of 12 FX pairs into eight relative currency scores and residual confidence.

TF Portfolio Exposure & Stress
Read-only account dashboard for FX concentration, stop-defined risk, unbounded positions and four transparent stresses.

TF Economic Event Risk Map
Trade-server-time MT5 calendar zones, grouped event labels, countdown, cache age and explicit stale-data state.

TF Regime Persistence Map
Causal four-state behaviour map from efficiency, sign entropy, volatility percentile, range expansion and hysteresis.

TF Liquidity Friction Monitor
Broker-relative friction score from historical spread cost, tick-volume drought and normalized opening gaps.

TF Jump & Tail Risk Decomposition
Twenty-bar realized-variation decomposition with jump share, downside semivariance and robust tail surprise.
Choose a compatible platform for your country
Compare MT5 access, the contracting company and total trading costs. A new or funded account is not required to download this tool.
Compare broker reviews · Read the Tickmill EU review · Check HFM eligibility
HFM Europe currently does not accept retail or elective professional clients. Broker reviews identify affiliate links; we may receive compensation from qualifying referrals.
New research utilities
These beta builds include source, EX5 and documentation. Compilation is complete; runtime acceptance and performance testing are pending.

TF Sessions and Previous Levels
Overlay Tokyo, London and New York session ranges plus the prior broker-day and broker-week high and low.

TF Position Planning Overlay
Drag entry, stop and target lines to inspect a lot-step-rounded risk estimate and net reward/risk. This indicator sends no orders.

TF Multi-Timeframe Trend Dashboard
Compare the fast and slow EMA on closed M15, H1, H4 and D1 bars, with the difference expressed in ATR units.
TF ADR and ATR Dashboard
Compare today’s broker-day range with average completed daily ranges and a closed-bar ATR reading in native price units.

TF Correlation Matrix for MT5
Compare timestamp-aligned closed-bar log returns across two to six exact broker symbols, with the matched sample count shown in every cell.

TF Session and Anchored VWAP
Plot volume-weighted bar typical price from a UTC session boundary or a chosen server-time anchor, with an explicit tick-volume or reported-volume basis.