
Expert Advisors for MT5
Explore every strategy and trading utility. Compare measured results, read the rules and tailor a preset for your next test.
Current strategy identities and evidence
Source mapping is complete for the 17 legacy strategy packages; testing is not complete. The main library contains 31 versioned strategy EAs. The older catalogue contains 17 strategy variants and 4 utilities. Related variants retain separate rules, downloads and evidence. Utilities have no autonomous entry strategy.
No legacy EA currently qualifies for a profitability badge on the approved tick release. A functional entry or exit proves only the observed behaviour. The recent February 2024 diagnostics use real bid/ask ticks, zero added commission and delay, and unverified historical swap values; positive cash in that sample is not after-cost profitability.
Open all 17 strategy–EA mappings. Cards distinguish current cost research from retained historical results. Read each card's evidence scope; category labels do not establish profitability.
Versioned inventory and diagnostic status · EA downloads and utilities
Every strategy includes source, EX5, backtest graphs and an editable MT5 preset. Changed settings require a new test; historical results stay tied to the published preset. MT5 installation guide.
21 of 21 EAs and utilities shown
No matching EAs. Clear the search or choose All.
Non-profitable
12The selected configuration lost money in the 12-month or long-period confirmation. All files, graphs and adjustable presets remain available for research.

Donchian ATR
Donchian breakout with EMA filter and ATR stop/R target.
February 2024 exact-public-binary diagnostic: 1 entries, 1 exits and 1 tester-end closes; zero added fees/delay, swap unverified; profitability not established.
Current review: 20 fixed USDJPY H4 source-wrapper tests completed with base and stress fees/delay. Independent resets, reviewed skipped entries and unverified swap; no profitability qualification. Read evidence.

EMA Pullback ATR
EMA pullback in ADX-confirmed trend with ATR stop/R target.
Frozen 20-case EURUSD H4 cost research: base and stress fee/delay scenarios; reviewed skipped entries, independent resets and unverified historical swap; no profitability qualification.
Current review: 20 fixed EURUSD H4 research tests completed with base and stress costs; funding and broader validation remain unverified. Read evidence.
RSI Trend Pullback
RSI pullback/recovery in EMA and ADX trend.
20 USDJPY H1 cost tests: base USD 3.50/lot-side, 0 ms; stress USD 7.00/lot-side, 200 ms. Net before unverified financing: USD 23.12 / -131.06. Ten independent resets per scenario, no rejected entries recorded; profitability not established.
Current review: Older 9%-tick-coverage report contains trades; approved-data validation remains. Read evidence.

Atlas TrendGuard
Donchian, EMA and ADX trend breakout with ATR exits/trailing.
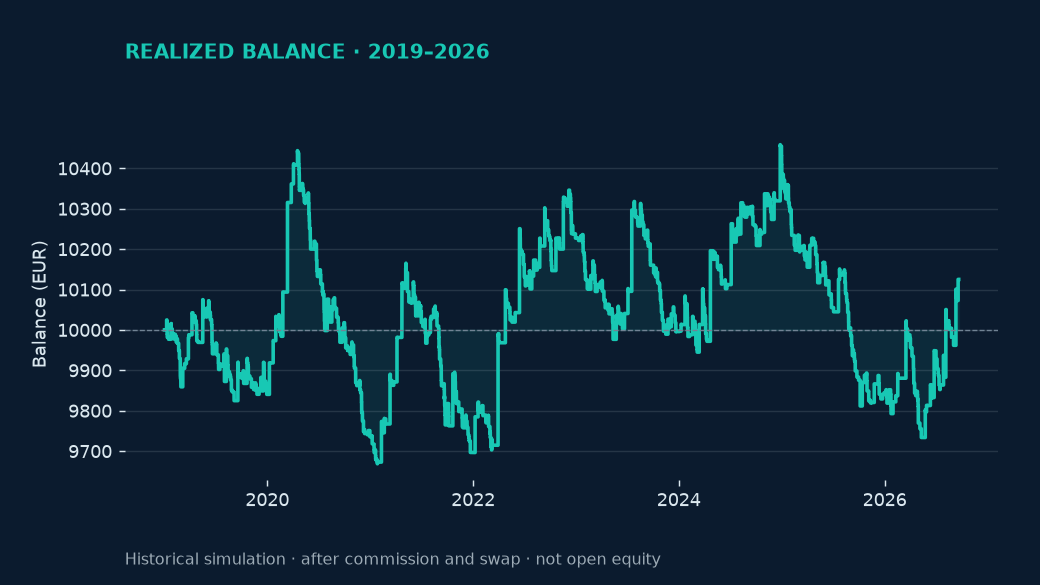
After commission & swap · historical simulation
Current review: February 2024: 12 entries, 9 SL exits, 2 TP exits and 1 tester-end close. Read evidence.
Time-Series Momentum
Closed-bar time-series momentum.
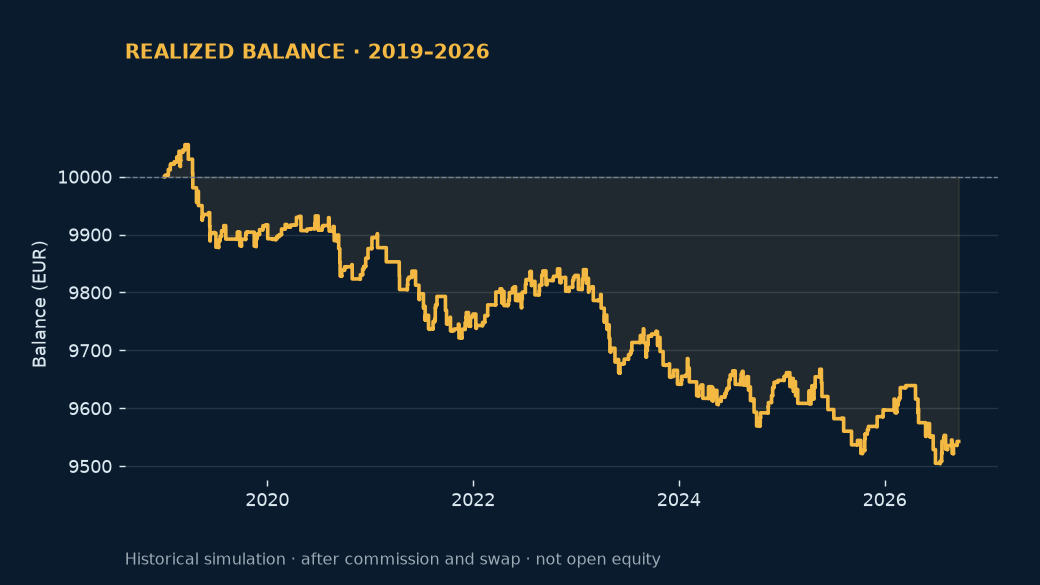
After commission & swap · historical simulation
Current review: February 2024: 11 entries, 1 SL exit, 9 other ordinary exits and 1 tester-end close. Read evidence.
Asian Range Fade
Asian range re-entry/fade.
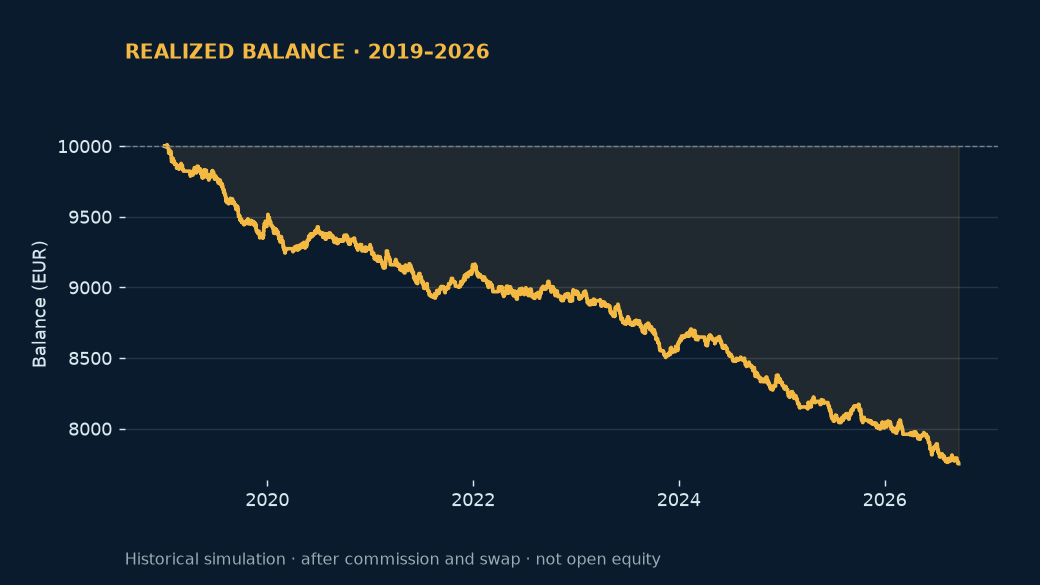
After commission & swap · historical simulation
Current review: February 2024: 3 entries, 2 SL exits and 1 TP exit. Read evidence.
London Fix Reversal
London-fix reversal timed with broker/London DST.
After commission & swap · historical simulation
Current review: February 2024: 19 entries, 3 SL exits and 16 other ordinary exits. Read evidence.
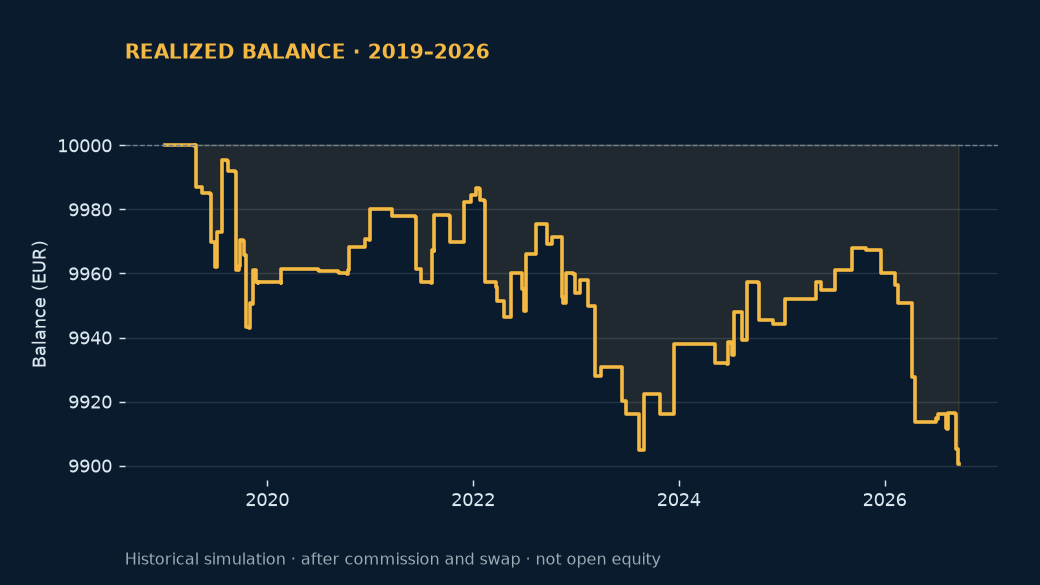
NR Inside-Bar Expansion
Narrow-range/inside-day H1 expansion.
After commission & swap · historical simulation
Current review: May 2024 follow-up: 1 entry and its ordinary 48-hour time exit confirmed. February had no setup. Profitability unproven. Read evidence.
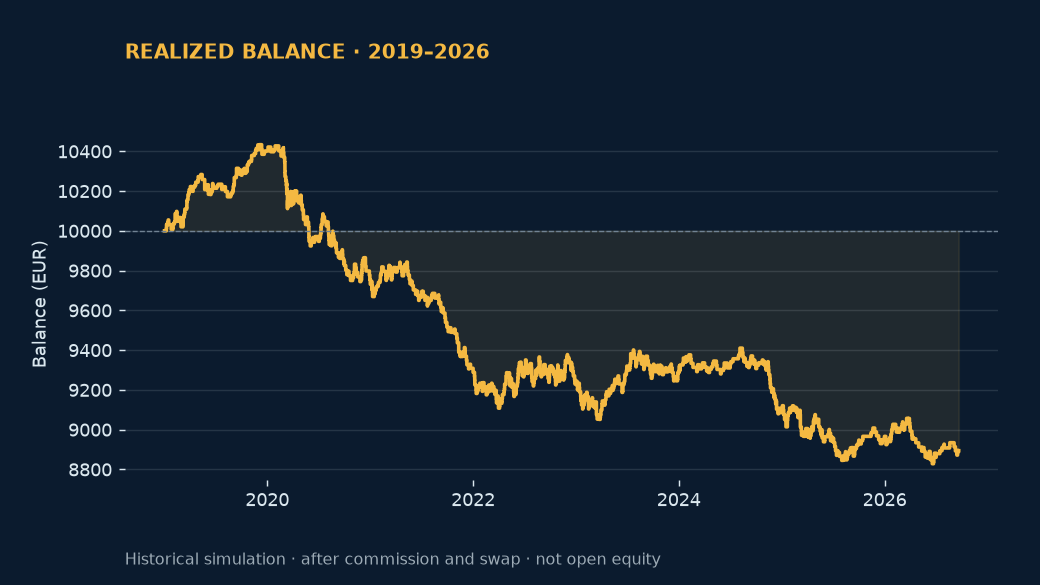
EMA20 MACD Momo
M5 EMA20/MACD momentum, 1R partial and EMA trail.
After commission & swap · historical simulation
Current review: February 2024: 5 entries and 6 exit deals: 4 SL, 1 partial and 1 tester-end close. Read evidence.
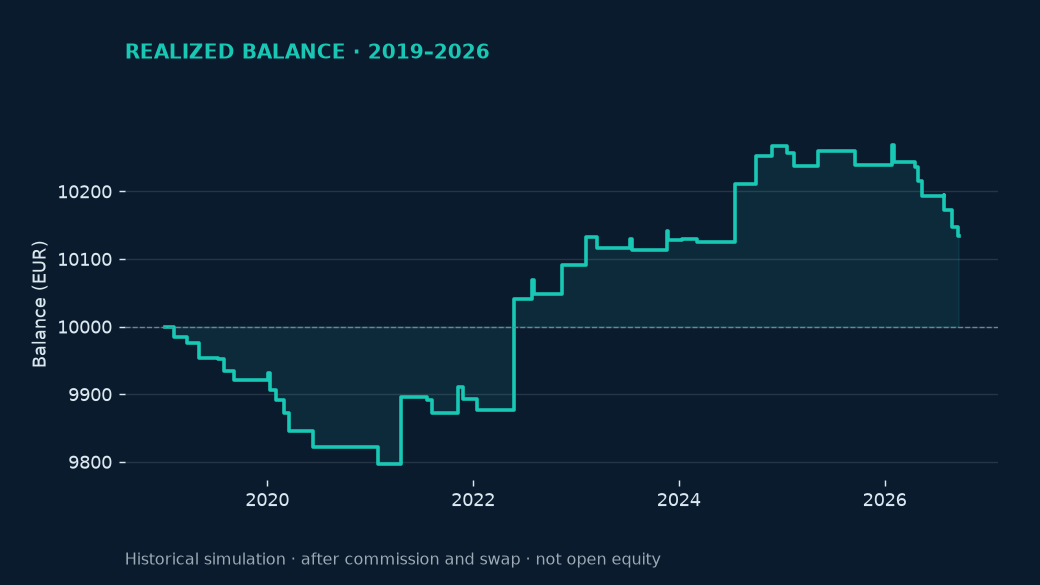
Turtle System 2
Turtle S2 channel breakout, 2N stop, 20-day exit.
After commission & swap · historical simulation
Current review: February–March 2024 follow-up: 2 entries, 1 ordinary long-channel exit and 1 tester-end close. Warmup gaps disclosed; profitability unproven. Read evidence.
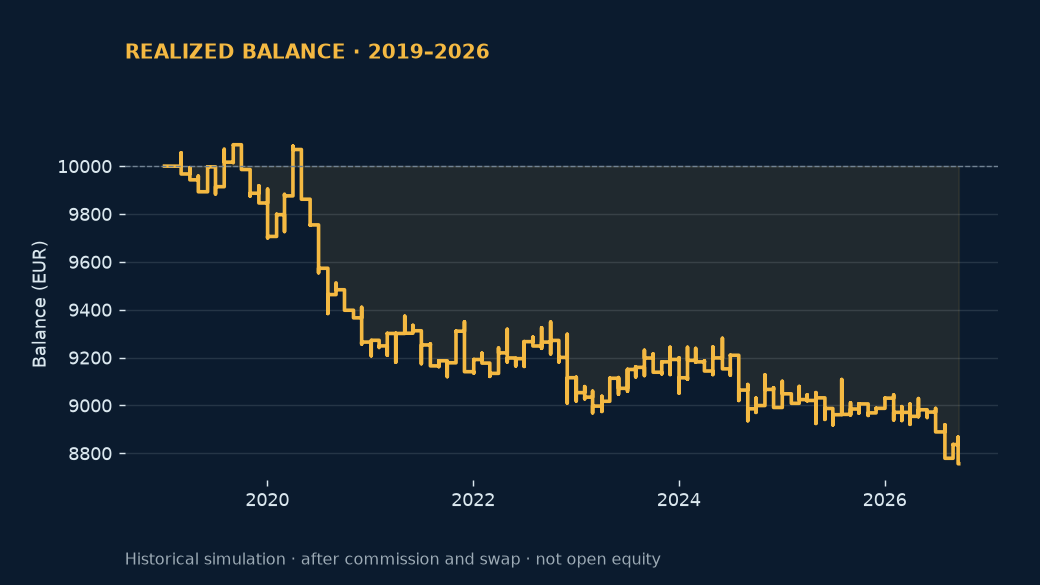
Monthly Currency Momentum
Monthly six-currency top-two/bottom-two momentum basket.
After commission & swap · historical simulation
Current review: Hard-coded broker symbols need a separately reviewed custom-symbol adapter; no approved-data diagnostic yet. Read evidence.
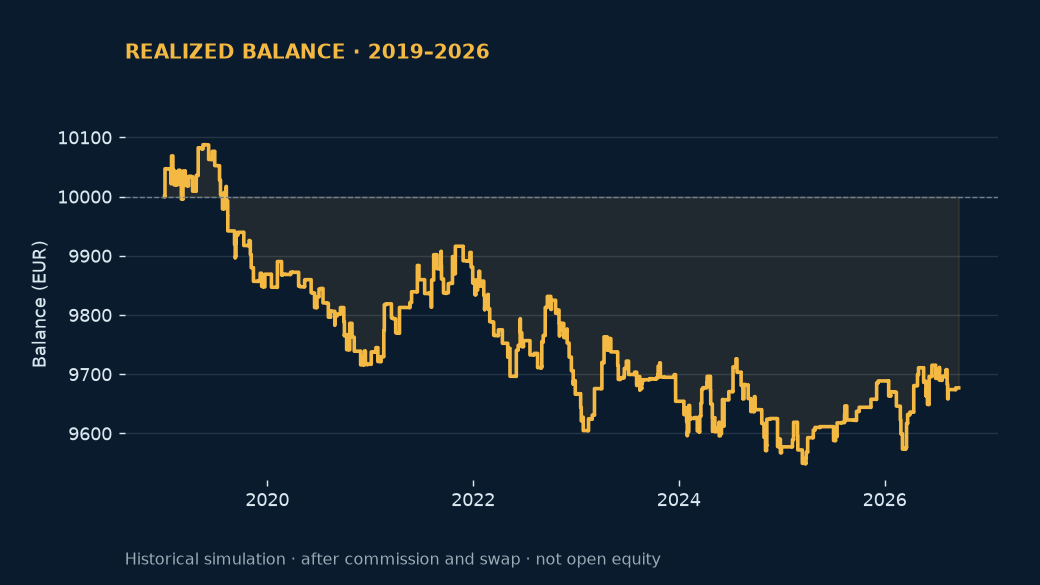
EMA RSI Crossover
H1 EMA 12/26 crossing with RSI confirmation, BE and trailing.
After commission & swap · historical simulation
Current review: February 2024: 4 entries, 3 SL exits and 1 TP exit. Read evidence.
New research / Utilities
9Five strategies need stronger evidence or data; four utilities support trading and record keeping. Utilities are assessed for functionality and have no standalone profit curve.
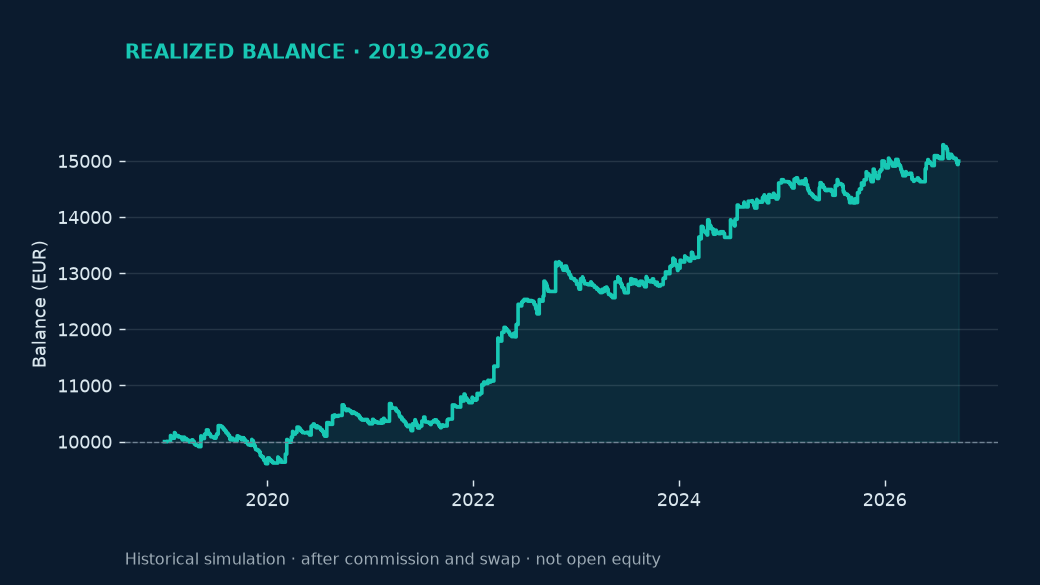
Volatility Squeeze Breakout
Closed-bar volatility squeeze then channel breakout.
Repaired v1.02: 20 USDJPY H1 cost tests. Base USD 3.50/filled-lot-side, 0 ms; stress USD 7.00/side, 200 ms. Net before unverified financing: USD +2870.50 / +2276.59; pooled PF 1.2527 / 1.1939. Ten independent resets per scenario, 7/10 positive. Historical research; profitability not established.
Current review: *Sum of ten independent test resets, not a continuous return. Financing unverified; no profitability badge. Thumbnail shows historical v1.01 broker data. Read evidence.

Bollinger RSI Range
Bollinger-band reversion with RSI and ADX filters.
One October 2020 long TP replayed under two cost assumptions; funding remains unverified.
Current review: Twenty EURUSD H1 cost tests are not 20 trades: one underlying October 2020 long TP and nine inactive windows per scenario. Net before unverified funding: USD 32.31 / USD 31.77. Evidence is insufficient; no profitability badge. Read evidence.
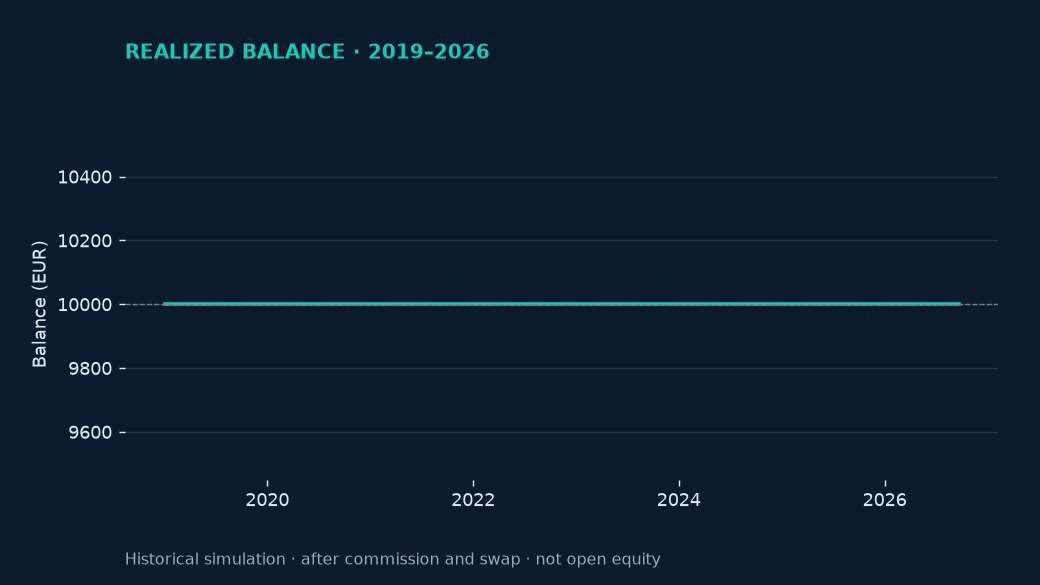
Session Breakout Research
Local-session range followed by breakout.
Current review: 20 frozen EURUSD M5 cases: 1,498 closed positions per scenario; pooled PF 0.8759 / 0.8301 before unverified financing. The corrected London preset is functional evidence only; profitability is not established. Read evidence.
Earlier functional sample: Corrected session 0: 11 entries, 10 ordinary exits and 1 tester-end close in February 2024. Read evidence.
*Ten independent USD 10,000 resets per scenario, not a continuous account return. Historical financing is unverified.

Currency Carry Risk
Policy-rate carry CSV portfolio with margin, risk and calendar filters.
After commission & swap · historical simulation
Current review: Approved-tick fixture: 4 entries at USD 25,000 and 4 wrapper-cleanup exits; natural exits and performance remain. Read evidence.
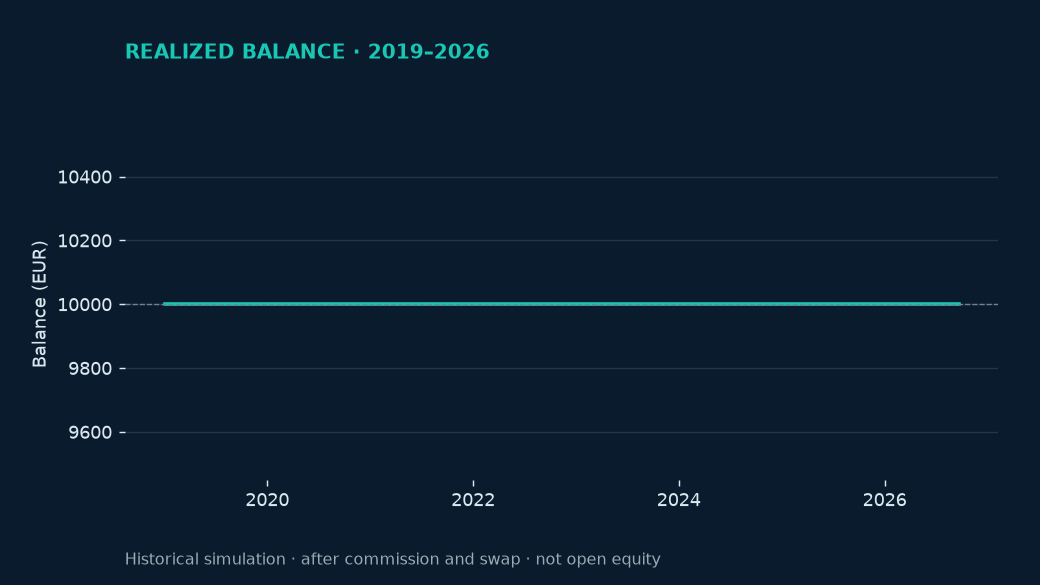
Weekend Gap Fade
Monday gap fade toward Friday close. The linked strategy page retains the historical charts and February 2024 single-trade check separately.
Current review: Frozen 20-case EURUSD H1 cost evidence: 75 positions per scenario; pooled PF 0.8930 / 0.7780 before unverified financing. Profitability is not established. Read evidence.
Earlier functional sample: Corrected session 0: 1 entry and ordinary TP exit in February 2024; original session 1 blocked it. Read evidence.

TF Position Manager for MT5
Preview a risk-sized market order from a chosen stop, then explicitly confirm it on a demo account. Real-account order operations are disabled.
Functional acceptance checks · no profit claim

TF Trade Manager for MT5
Study break-even, closed-bar ATR trailing and optional partial closing for one explicitly selected MT5 position ticket.
Functional acceptance checks · no profit claim

TF Account Risk Guard for MT5
Monitor loss from a daily equity baseline and current-to-stop portfolio risk. Publish a pause signal for cooperating EAs with the same magic number.
Functional acceptance checks · no profit claim

TF Execution Logger for MT5
Write new MT5 deal events to a local CSV with fills, volume, fees and event-time quotes. The logger never sends or modifies orders.
Functional acceptance checks · no profit claim
How to read the archived results
All 17 selected strategy configurations have a 12-month review (2025.09.01–2026.09.01) and a long review (2019.01.01–2026.09.21). End dates are exclusive. Each detail page includes graphs, original MT5 reports and the exact selected preset.
Test conditions, selection criteria and data limitations
EUR 10,000 initial capital; 1:30 leverage; 100 ms delay. Development: 2019–2023; validation: 2024, both native M1 OHLC. Confirmation uses “Every tick based on real ticks” with available IC Markets history and native fallback. Native commission and swap are included.
Promising requires positive development and validation, positive net in both confirmation periods, PF ≥ 1.10 / 1.05, equity drawdown ≤ 15%, and positive net after adding 25% of absolute commission and swap. Trade-count gates: 12 / 40, or 6 / 30 for Turtle. A negative confirmation is non-profitable; other unmet gates remain new research.
72 configurations were investigated across 17 strategy implementations. Results are retrospective, with no fresh independent holdout. A history-quality label is not a guarantee of complete ticks; the multi-currency quality figure does not certify every secondary symbol. Charts show realized balance, while equity drawdown comes from the native report.
The older incomplete-tick campaign had one candidate meeting its retrospective gates. That former Promising designation has been withdrawn. No legacy candidate currently has approved-data, after-cost profitability qualification. Historical category labels describe only those old configurations and reports.