
Currency portfolios
Monthly Currency Carry
Original operational carry portfolio that ranks observable one-month FX forward discounts/premia, rather than inferring rates from a broker display.
- Category
- Currency portfolios
- Timeframes
- D1 (monthly portfolio rebalance)
- Pairs
- AUD, CAD, CHF, EUR, GBP, JPY, NOK, NZD and SEK versus USD
- Test status
- Monthly family research; exact portfolio test incomplete
How the rule works
Carry seeks compensation embedded in relative funding prices, rather than a chart pattern. Under the USD-per-foreign quote convention, S greater than F produces a positive carry score. A negative currency spot move can overwhelm that carry, especially during correlated unwinds. An institutional forward portfolio is materially different from holding retail MT5 CFDs with broker-specific swaps.
Setup
- Use a fixed universe of AUD, CAD, CHF, EUR, GBP, JPY, NOK, NZD and SEK versus USD. Normalize every spot quote to Q = USD per one unit of foreign currency; invert USD/foreign quotes before computing returns. Synchronize closing observations at 17:00 America/New_York using a historical broker-offset schedule. Require 300 common, valid daily observations and at least six eligible currencies.
- At the last completed New York trading day of each month, freeze the ranking. Define t as that completed close. Ties are resolved alphabetically by ISO currency code. Set n=floor(number eligible/3), and select the highest n and lowest n currencies. Submit the rebalance at 08:00 Europe/London on the next common trading day, using then-executable prices.
- Rank by carry=(S/F−1)×365/D, using actual maturity D and contemporaneous mid quotes observed before the rebalance decision. Positive carry means a foreign currency priced at a forward discount under this quote convention. Use executable forward ask/bid for trades, not ranking mids. Omit stale or unavailable forwards; never infer institutional carry solely from current central-bank policy rates.
Indicators
- Same-timestamp spot S and one-month outright forward F, both USD per foreign currency
- Carry score (S/F−1)×365/D, where D is actual calendar days to forward maturity
- 60-day sample covariance of normalized daily spot log returns
Long entry
- Buy the high-carry currency forward against USD or construct equivalent spot-plus-financing exposure only when its financing terms are explicitly recorded.
Short entry
- Sell the low-carry currency forward against USD under the same convention.
Stop loss
- There is no guaranteed per-leg price SL. At each completed New York daily close, value portfolio NAV after costs. If NAV/NAV_at_month_start−1 <= −0.07, request liquidation of every tradable leg at the next executable quote and remain in cash until the next monthly decision. This is a 7% month-to-date loss trigger, not a maximum drawdown guarantee; gaps and untradeable quotes can make losses larger.
Exit
- At the next monthly rebalance, close legs no longer selected and adjust surviving notionals to the newly computed weights. Roll forward contracts on their stated settlement/maturity schedule using actual executable quotes. The signal does not justify allowing an expiring contract to settle accidentally.
- If a required quote is missing, initiate no new portfolio. Existing exposure remains a recorded risk until an executable quote becomes available; request exit then. Never fill a suspended market at its last stale price or pretend it could be force-closed after a fixed number of days.
Risk and position size
- Compute individual volatilities from 60 daily log returns. Within each selected tail, normalize inverse-volatility weights to +0.5 for the long side and −0.5 for the short side. If any volatility is zero or inputs are missing, do not initiate the portfolio. Let w be this signed weight vector and Σ the 60-day sample covariance matrix. Annualized portfolio volatility = sqrt(252 × wᵀΣw).
- Multiply every weight by k=min(0.07/portfolio volatility, 1.2/sum(abs(w)), 0.15/max(abs(w))). Thus volatility is a target ceiling of 7% rather than a guaranteed risk level; gross exposure is at most 120% of NAV and each currency at most 15%. Convert notionals to executable lot/contract sizes by rounding down and recheck caps.
Costs and execution
- Include bid/ask on every entry, reduction and roll, commissions, financing or forward points, and account-currency valuation. Do not splice spot returns, forward excess returns and broker swaps into one unexplained series. Forward quotes, calendars and historical funding must be independently available; an MT5 spot screenshot does not supply them.
When the method can fail
- Carry can suffer sharp unwinds during stress; exclude holiday/stale forwards and publish each currency's funding convention.
Worked example
- Hypothetical S=1.1000 USD per currency unit, F=1.0950 and D=30 imply (1.1000/1.0950−1)×365/30=5.56% annualized carry score. This is a ranking statistic, not a promised yield: a 2% adverse spot move over the month can exceed the forward discount. A retail swap quote cannot establish that this executable one-month forward exists.
Monthly family research and remaining test gap
The exact portfolio specification above remains incompletely tested. Public Internet data now supports the separate monthly family analysis below. A positive research result is not a pass for the strategy on this page.
Source: Adrien Verdelhan’s public MIT workbook, country-level monthly exchange-rate changes and interest-rate differences. Research window: 1984-03-30–2020-04-30; 434 calendar months including cash periods. The universe uses the nine named G10 currencies where observations are available, with at least six eligible currencies.
| Assumed cost | Months | Annualized net | Monthly profit factor | Max drawdown | Later-half annualized |
|---|---|---|---|---|---|
| 5 bp × turnover | 434 | +1.37% | 1.33 | 12.56% | +0.82% |
| 10 bp × turnover | 434 | +1.21% | 1.29 | 12.80% | +0.66% |
| 20 bp × turnover | 434 | +0.91% | 1.22 | 13.50% | +0.35% |
The reproducible monthly variant uses three-month momentum/volatility, lagged monthly interest differences for carry, top and bottom thirds, inverse-volatility weights capped at 20% per leg, and cash for rejected legs. Carry plus trend retains carry-selected legs only when their three-month trend agrees. Costs apply to absolute weight turnover, including closing to cash and final liquidation. Signals never use next-month prices or their availability.
Missing from this dataset: daily synchronized spot and forward levels, maturity and executable bid/ask, London 08:00 fills, NY 17:00 decision prices, daily volatility controls and the stated monthly loss-trigger exits. These cannot be reconstructed reliably from monthly returns. Historical interest differences are a funding proxy; they are not an executable forward quote.
MIT source and research datasets · Download full monthly results, units and data audit · Download reproduction code and source manifest
Execution and research protocol
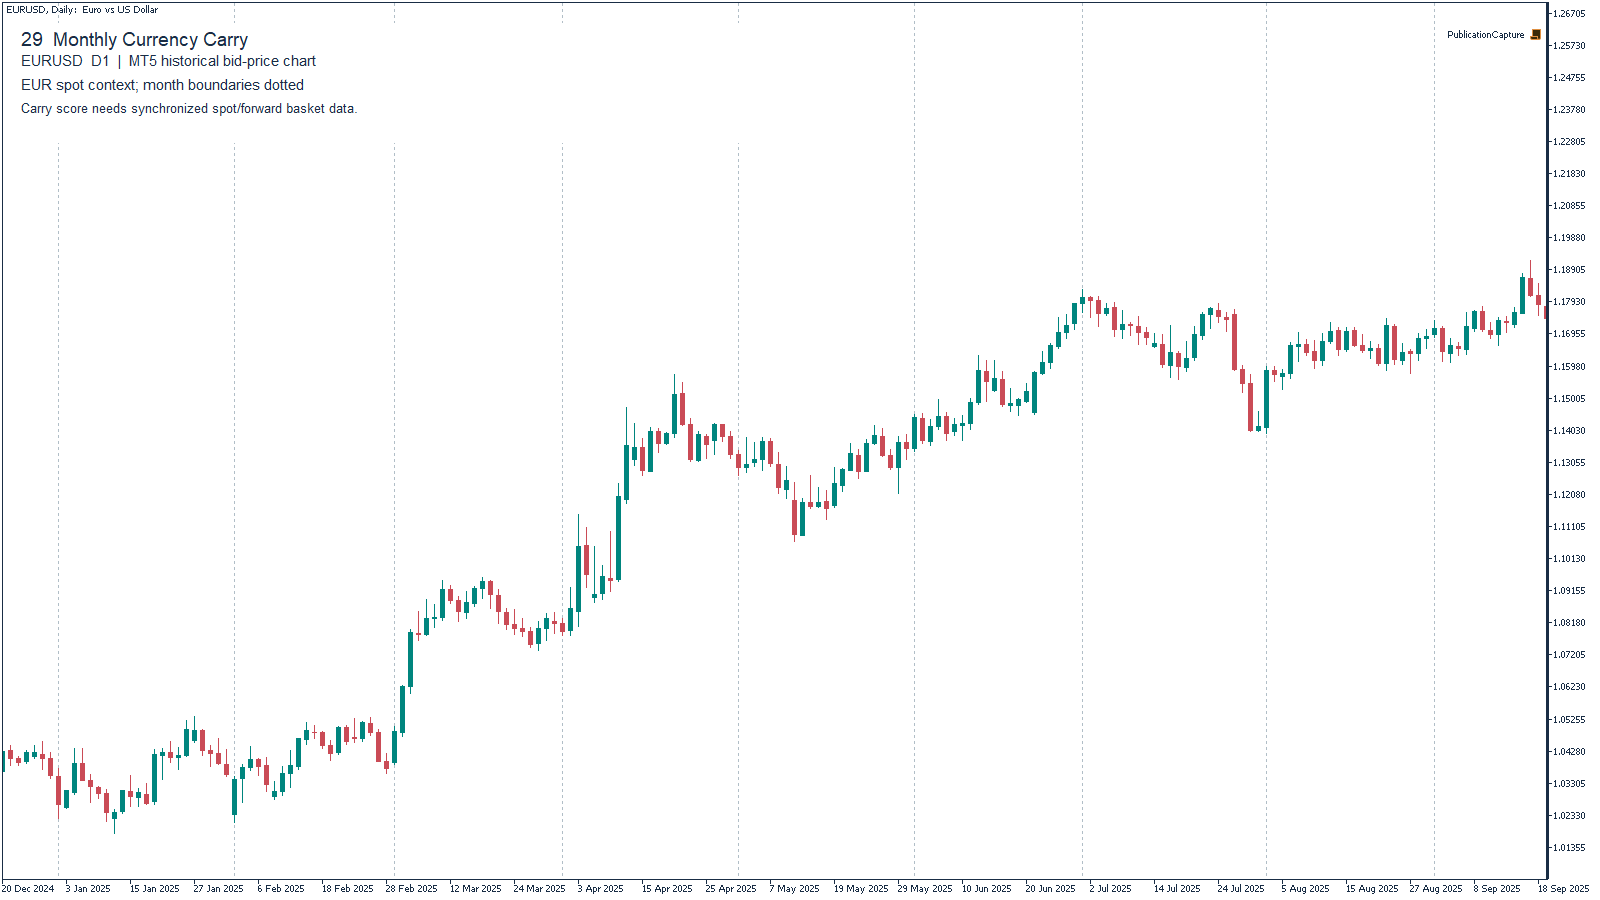
- A spot chart illustrates one currency only. It cannot show cross-sectional ranks, contemporaneous forwards, portfolio weights or actual trading costs. Obtain synchronized historical inputs for every constituent before testing this rule.
- Freeze signals using information available at the decision timestamp. Convert all exchange rates to the stated quote convention before calculating returns and covariance. Record missing observations, executable bid/ask, forward maturity, interest, rolls and each cash allocation.
- Validate the full portfolio out of sample, including transaction costs and historical funding. The monthly loss threshold is an exit trigger, not a guaranteed maximum loss: quotes can gap or become unavailable. This rule has no claimed verified portfolio performance.
Adapt and test your version
- Treat these inputs as a reproducible starting specification. Choose a currency pair, session and holding period that match the time you can monitor the market, then record any changes to indicator periods, thresholds, stop distance or exits as a new version.
- Change one hypothesis at a time. Reserve a later period and additional pairs for evaluation before looking at their results. Include your account’s actual trading and financing costs, compare small parameter changes, and forward-test on demo. A selected profitable window does not validate the strategy or its modified version.
Reproduce the chart in MT5
- Display a D1 spot chart for one portfolio currency with month boundaries marked. This is price context only: the ranking, financing and covariance calculations require a separate synchronized multi-currency dataset. The chart is not evidence that a portfolio entry passed those tests.
Sources
- FX strategies in periods of distress — Gyntelberg and Schrimpf (2011) — Carry strategy family and tail-risk discussion.
- Drivers of carry and currency momentum — Carry/momentum distinction and risk context.