
Follow the MT5 indicator installation guide for file locations, chart setup and troubleshooting. The walkthrough uses ATR Risk Bands; use this indicator’s own inputs and dependencies.
Already have a compatible account? You can use it. Otherwise, compare broker eligibility, platforms and costs before choosing.
TF Regime Persistence Map
Classify causal price behaviour as TREND, RANGE, TRANSITION or SHOCK with explicit component diagnostics and hysteresis.

Four independent behaviour inputs
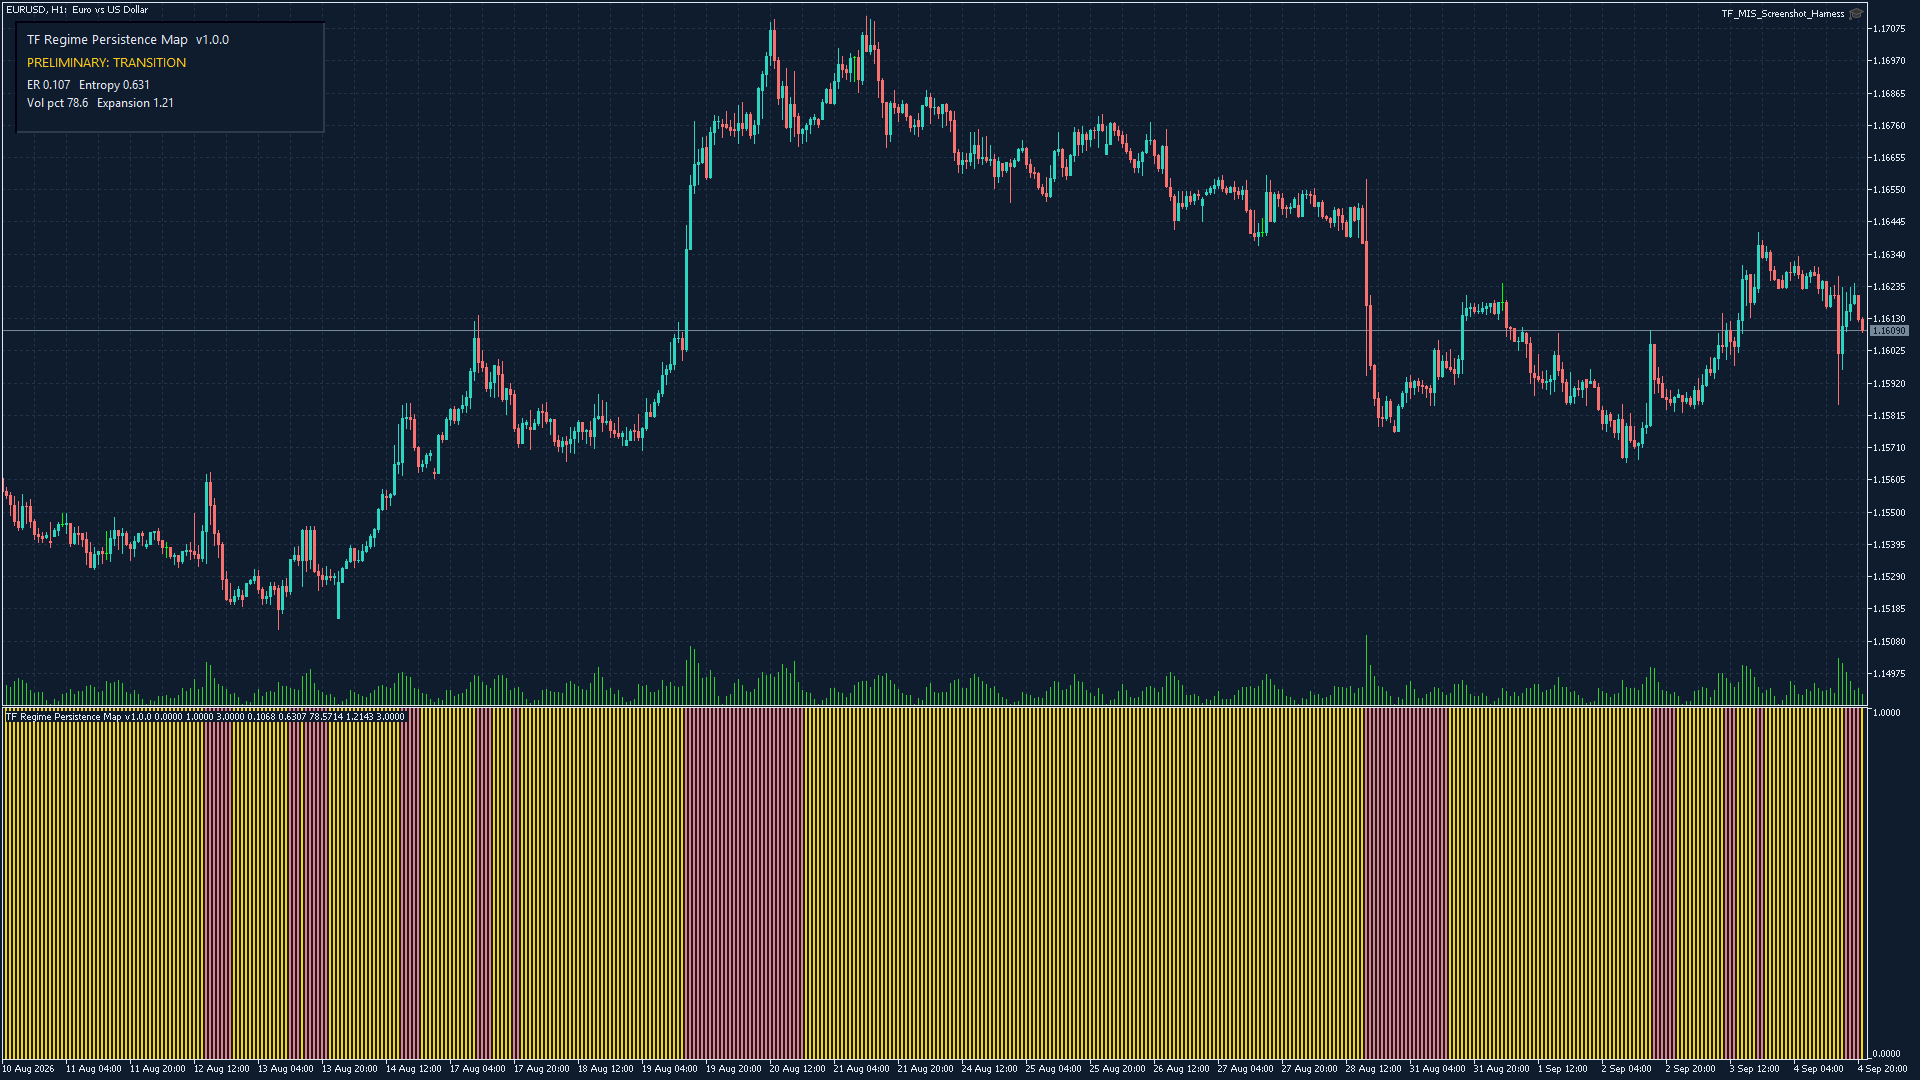
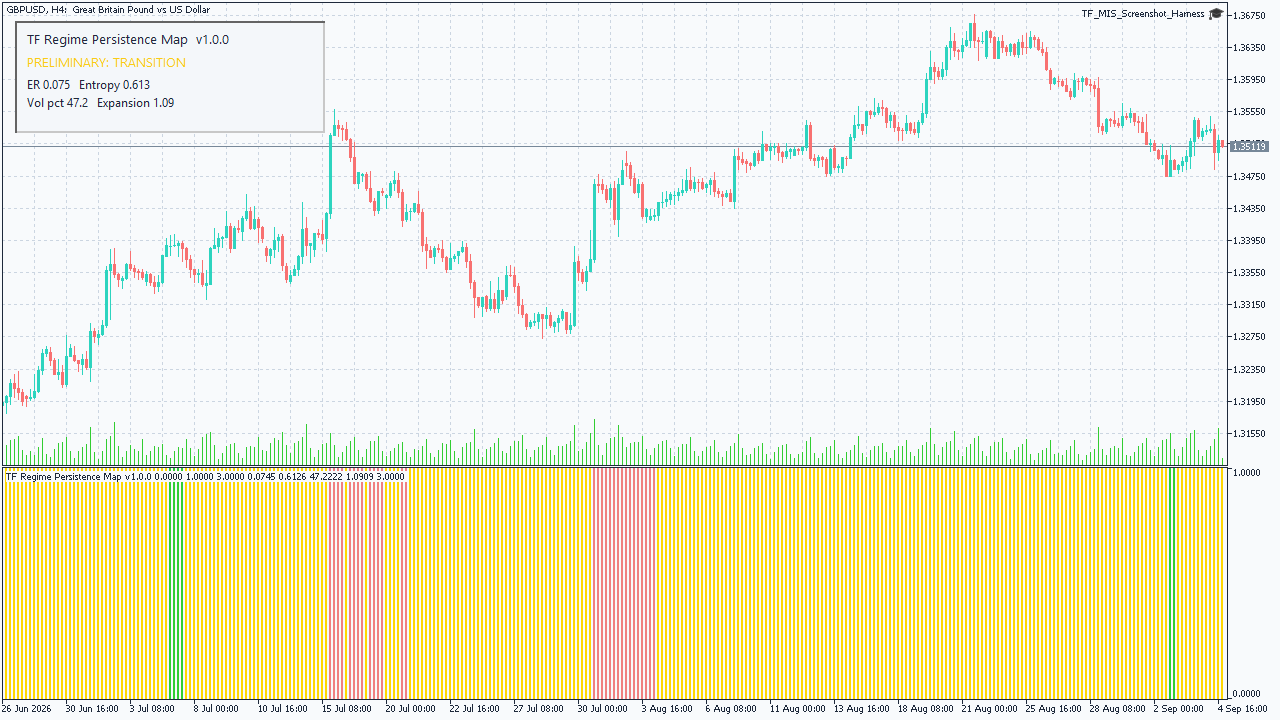
Median efficiency ratio and normalized sign entropy over 20/50/100 bars combine with a 20-bar realized-volatility percentile against 252 older estimates and 5-versus-60 median true-range expansion. Shock activates immediately on a closed bar; every other state change needs two consecutive closed bars.
| TREND | Efficiency ≥ 0.35 and entropy ≤ 0.90 |
|---|---|
| RANGE | Efficiency ≤ 0.20 and entropy ≥ 0.95 |
| SHOCK | Volatility percentile ≥ 90 or expansion ≥ 1.8 |
| TRANSITION | All remaining observations |
Auditable DataWindow
Confirmed/raw state, efficiency, entropy, volatility percentile and expansion are exposed. Maximum history is 100,000 bars.
Causal replay
Four synthetic regimes, flat/outlier cases and a one-bar-at-a-time non-repaint replay passed. MQL matched 1,000 golden rows exactly.
Four-colour band QA
Use in MT5
- Copy indicator and shared include files.
- Refresh Navigator and attach to a chart.
- Read bar 0 as preliminary; use closed bands for confirmed history.
- Enable the optional transition alert only if wanted.
Auditable release
Build 6163: 0 errors, 0 warnings. 100,000-bar first read completed in 4,616 ms. ZIP SHA-256: 16096293d0c3a2825c722899ddce9f1f00ee70c11cb8c0240aeb1bc2bd768fb2.
Market-behaviour context only. No promise of profit or personal investment advice.