
Trend & pullback
Fibonacci Retracement Trend Pullback
Original, algorithmic Fibonacci pullback specification that avoids discretionary swing selection.
- Category
- Trend & pullback
- Timeframes
- H4
- Pairs
- EURUSD, GBPUSD, USDJPY
- Test status
- Mechanical bar tests completed; profitability unverified
How the rule works
The difficult part of Fibonacci testing is defining the swing before seeing the outcome. This version fixes an algorithm, tie rule and minimum impulse size. Retracement ratios alone provide no evidence of a forecast edge; changing anchors after an adverse move would make an attractive illustration impossible to reproduce.
Setup
- Use bars [2]…[41], excluding the candidate signal. Bull trend requires EMA50[1] > EMA200[1]. Find the lowest low in that window (ties: most recent); among later bars up to [2], find the highest high (ties: most recent). Both anchors must exist and high−low >= 2×ATR14[2].
- For a bear trend EMA50[1] < EMA200[1], find the highest high in [2]…[41], then the lowest low chronologically after it and no later than [2]. Apply the same distance test and tie rule. Freeze the resulting anchors before considering bar [1]; never move them during a trade.
- For upward swing L to H, retracement level f is H−f×(H−L). For downward swing H to L, it is L+f×(H−L). Use f = 0.382, 0.500, 0.618 and 0.786.
Indicators
- EMA(50), Close
- EMA(200), Close
- ATR(14)
- Custom Fibonacci levels
Long entry
- Buy next ask when bar [1] overlaps the 50%–61.8% upward-swing retracement zone, closes above the arithmetic midpoint of that zone, closes above its open and above EMA200.
Short entry
- Sell next bid when bar [1] overlaps the 50%–61.8% downward-swing retracement zone, closes below the arithmetic midpoint of that zone, closes below its open and below EMA200.
Stop loss
- Long SL = min(signal low, upward 61.8% level) − 0.35×ATR14[1]. Short SL = max(signal high, downward 61.8% level) + 0.35×ATR14[1].
Exit
- Use one full-position target: the nearer profitable price of the frozen impulse extreme and 2R. Skip if the impulse extreme is already behind entry. This version has no unspecified partial exit.
- Exit long after a completed close below the frozen 78.6% level, short after a close above it, at the next quote. Time exit: 15 completed H4 bars.
Risk and position size
- 0.5% equity; split position only if broker supports partial close and both legs have stated fills.
Costs and execution
- Model spread, commission, slippage, swap and broker timezone; no idealized fill at a drawn level.
When the method can fail
- Swing algorithms can change when new bars arrive; freeze the swing at entry. Skip event windows.
Worked example
- Hypothetical upward impulse L=1.0800 to H=1.1000 creates 50%=1.0900, 61.8%=1.08764 and 78.6%=1.08428. Signal low 1.0880, bullish close 1.0895 and ATR 0.0020 can qualify. At entry 1.0896, SL=min(1.0880,1.08764)−0.0007=1.08694; the nearer 2R target is 1.09492.
Historical test results
No tested pair meets the complete research-screen criterion. Positive cells alone do not qualify the strategy.
18 mechanical runs across 3 pairs on H4. Decisions use completed strategy bars; fills use native ICMarketsEU-Demo M15 Bid candles with explicitly modelled costs. Full window: 1 January 2025–18 September 2026. Each row starts with an independent USD10,000 account.
| Pair | Period | Costs | Trades | Net return | Profit factor | Max drawdown | Ambiguous bars |
|---|---|---|---|---|---|---|---|
| EURUSD | combined | base | 83 | -6.35% | 0.7015 | 8.77% | 0 |
| EURUSD | combined | stress | 82 | -9.11% | 0.5843 | 10.33% | 0 |
| GBPUSD | combined | base | 83 | -7.83% | 0.6501 | 9.33% | 0 |
| GBPUSD | combined | stress | 86 | -9.08% | 0.6185 | 10.49% | 0 |
| USDJPY | combined | base | 71 | -5.82% | 0.6974 | 6.72% | 0 |
| USDJPY | combined | stress | 71 | -6.75% | 0.6524 | 7.57% | 0 |
Show 2025 and 2026 separately
| Pair | Period | Costs | Trades | Net return | Profit factor | Max drawdown | Ambiguous bars |
|---|---|---|---|---|---|---|---|
| EURUSD | 2025 | base | 42 | -4.19% | 0.64 | 5.54% | 0 |
| EURUSD | 2025 | stress | 42 | -4.67% | 0.6038 | 5.78% | 0 |
| EURUSD | 2026 | base | 41 | -2.27% | 0.7737 | 3.94% | 0 |
| EURUSD | 2026 | stress | 40 | -4.70% | 0.5625 | 5.27% | 0 |
| GBPUSD | 2025 | base | 45 | -3.61% | 0.6982 | 5.89% | 0 |
| GBPUSD | 2025 | stress | 47 | -4.27% | 0.6673 | 6.46% | 0 |
| GBPUSD | 2026 | base | 38 | -4.51% | 0.5816 | 5.51% | 0 |
| GBPUSD | 2026 | stress | 39 | -4.97% | 0.5663 | 5.99% | 0 |
| USDJPY | 2025 | base | 49 | -5.10% | 0.6306 | 6.26% | 0 |
| USDJPY | 2025 | stress | 49 | -5.52% | 0.6023 | 6.61% | 0 |
| USDJPY | 2026 | base | 22 | -0.74% | 0.871 | 2.01% | 0 |
| USDJPY | 2026 | stress | 22 | -1.21% | 0.793 | 2.38% | 0 |
Costs, execution and qualification criteria
Base: Spread 1.0 pip for majors; 1.5 EURGBP/EURJPY; 2.0 GBPJPY/AUDNZD. USD7/100k round-trip commission; 0.1 pip adverse market/stop slippage per fill. Financing=max(negative current native swap,0.2pip/night), no positive credit, native triple-swap day.
Stress: Double base spread; 0.3 pip adverse slippage/fill; same commission; double max(negative current native swap,0.5pip/night).
Research candidate only if a pair has >=30 trades in EACH calendar subperiod, positive net returns and PF >=1.10 in EACH subperiod under BOTH cost scenarios, and combined maximum drawdown <=15% under BOTH scenarios. Not a statistical profitability proof. All pairs and failures are retained.
Profit factor is the sum of positive net trade results divided by the absolute sum of negative results. Drawdown includes adverse M15 intrabar marks. The end of each test window liquidates open positions, so separate subperiod returns do not add exactly to the continuous-window return.
- Bar execution, not a real-tick MT5 Strategy Tester run. Same-bar ambiguity is treated adversely and counted.
- Current swap snapshot is an explicit stress assumption, not historical funding.
- One isolated USD10,000 account per strategy/pair, leverage ceiling30, broker minimum lots and steps. Results cannot be added into one portfolio.
- 2026 is a later evaluation slice, not untouched independent out-of-sample evidence; no parameter optimization was performed.
- Retrospective scheduled MT5 calendar may contain revised release times. UTC export normalized to NY-close broker clock against BLS releases.
- General discretionary event avoidance is fixed as high-impact events for either currency +/-30min. IDs1/17 next60min; ID20 next120min. ID13 UK bank holidays excluded. Subjective trend quality, unscheduled events and all-country holiday/session quality are not fully quantifiable; these are documented mechanical variants.
- Sparse broker histories are reported with shorter effective coverage and are ineligible for a candidate label.
- Native indicator parity: ATR, SMA, RSI, MACD, bands, stochastic, WPR, CCI and Ichimoku matched native buffers on EURUSD H4 within rounding tolerance; Wilder ADX matched the MetaQuotes ADXW example. EMA200 seed residual at 1,000 bars was 0.000000715, falling below 0.0000000001 after 2,000 bars.
- Built-in iSAR differs from the published MetaQuotes example on reversal bars. ID9 therefore uses actual built-in iSAR buffers exported by MT5, joined by timestamp, not the approximate Python SAR. Native GBPUSD/USDJPY SAR history needs 300 warm-up bars from January 2025, so those rows start later and cannot pass the full-period screen.
- 37 automated checks passed: execution gaps, short ask prices, ambiguous stop/target candles, partial commissions, pending expiry, time zones, rule regression cases and monthly portfolio no-lookahead/cash costs.
Interpretation: these are mechanical bar-model tests, not verified real-tick or live performance. Price rules were held fixed; subjective market-quality exclusions remain outside the mechanical model. Strategy adaptation requires a new test.
Download all test metrics and assumptions (JSON) · Download simulated trade logs and reproducible research code · Broker commission and swap documentation
Execution conventions
- Bar [0] is forming; [1] is the most recently completed bar. Unless explicitly stated otherwise, indicators use Close with zero plot shift and signals use completed bars. EMA is exponential, SMA is arithmetic and MT5 ATR is its native true-range average. Use at least 300 completed warm-up bars; a longer rule-specific requirement takes priority.
- A close-based signal is executed at the first available quote after the close, never retrospectively at the signal close. Buy at ask, sell at bid; close longs at bid and shorts at ask. A standing stop or target can fill within a bar. A gap through a stop fills at the first executable price, which can be worse than the stop.
- R means the initial entry-to-protective-stop distance, fixed at entry. Convert that distance into account-currency loss using the symbol tick size and loss-side tick value. Lots = cash risk / loss per lot, rounded down to the broker volume step. Round prices to the trade tick and recheck risk plus minimum stop/freeze distances before submitting. Budget commission and slippage separately; skip if minimum size exceeds the risk limit.
- Use one position per symbol and no averaging down. A trailing stop only tightens after a completed bar and becomes active on the next quote. The entry bar is holding bar one; a time exit executes on the quote after the specified holding bar closes. When a hard stop and a close-based exit compete, the stop already active takes precedence. With OHLC-only data, assume stop before target if both can occur in one bar; tick data is needed to resolve the order.
- The article defines the price rule. Any discretionary news exclusion changes the tested variant and must be recorded in advance. Map broker timestamps to the named London/New York time zone using historical daylight-saving offsets; do not assume a fixed UTC offset. Include spread, commission, slippage, overnight financing and triple-swap days in a profitability test.
Adapt and test your version
- Treat these inputs as a reproducible starting specification. Choose a currency pair, session and holding period that match the time you can monitor the market, then record any changes to indicator periods, thresholds, stop distance or exits as a new version.
- Change one hypothesis at a time. Reserve a later period and additional pairs for evaluation before looking at their results. Include your account’s actual trading and financing costs, compare small parameter changes, and forward-test on demo. A selected profitable window does not validate the strategy or its modified version.
Reproduce the chart in MT5
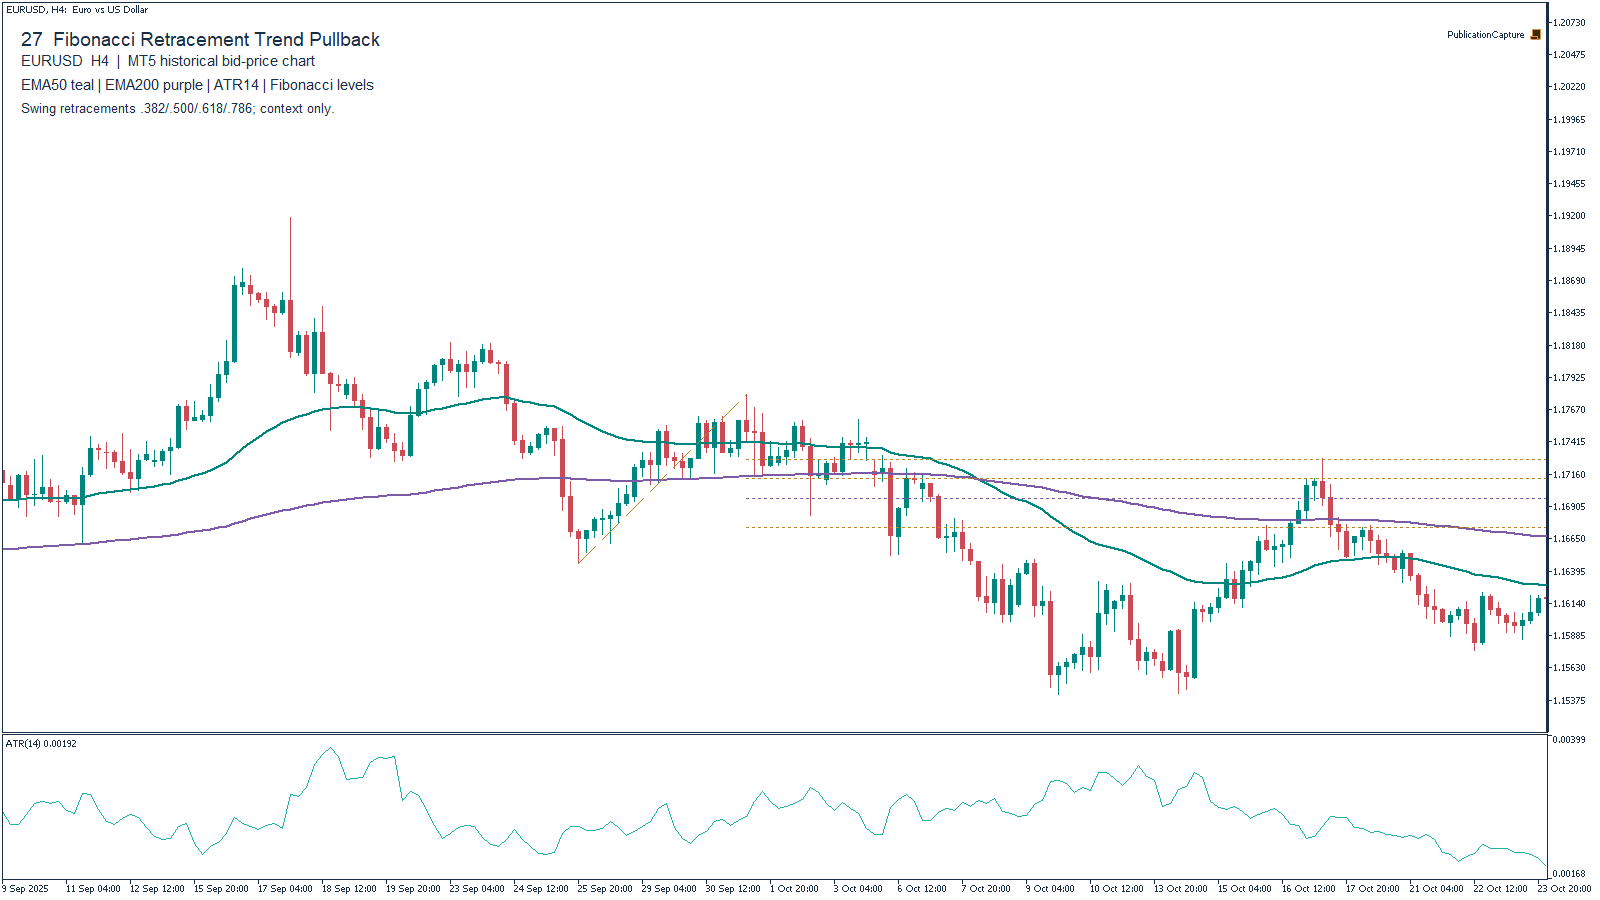
- Open EURUSD on H4. Add the indicators listed above through Insert → Indicators; use Close and zero shift unless a different setting is specified. The Data Window displays exact values for the selected completed candle.
- Compare the signal candle with the required earlier bars before moving forward. Use the crosshair to read prices and times. For custom channels, session levels or Supertrend, reproduce the formula in this guide and check the calculation before relying on an external indicator.
- Draw entry, initial SL and target only after a candle has satisfied every condition. Label planned levels as plans; they do not demonstrate a historical fill. The featured chart is genuine historical MT5 context and is not a trade-performance report.
Sources
- Fibonacci Retracement — MT5 drawing-tool availability.
- Moving Average — EMA trend filter.