
Donchian ATR
Donchian breakout with EMA filter and ATR stop/R target.
USDJPY · H4 · Original trading hours
Source + EX5 + selected preset + checksums. Strategy Tester research build.

Current EA identity and test status
Reviewed 23 September 2026. Separate legacy variant; profitability not established.
Prior full report contains 314 trades but only 9% real-tick coverage. Approved-data performance has not been reproduced for this legacy preset.
Which rules and EA belong together?
Selected H 4 preset: 20-bar channel, EMA 100, ATR 14 stop at 2 ATR, fixed 3 R target and 0.25% balance risk. Source defaults instead use channel 55/EMA 200/2.2 ATR/2.5 R/0.50%.
The library EA uses D 1 20/10 breakout/exit rules. Different timeframe, filters and exits mean these are separate implementations.
Library strategy 1: Donchian 20/10 Close Breakout has its own EA download and evidence. Use the download on this legacy page only with the legacy rules and preset described here.
The older reports below use incomplete broker ticks and fallback data. Their old classifications and returns are historical observations, not validation on the ten-year approved bid/ask release. A profitable sample, zero-trade report or functional diagnostic is not an after-cost profitability qualification.
February 2024 native functionality observation
Exact selected public binary; functionality only, not profitability. The unchanged USDJPY.TFQ1 H4 preset ran from 1 February 2024 inclusive to 1 March exclusive at broker UTC+2 with USD 10,000, 1:100 leverage, real-tick Model 4, and zero added commission and delay. It processed 3,136,638 ticks and 126 chart bars.
Native ledger: 1 entry deals, 1 exit deals, 0 partial exit deals and 1 tester-end exit deals. First entry: 2024.02.02 16:00:00 broker; buy in; 0.02 lots at 147.970 (TF Donchian ATR). First exit: 2024.02.29 23:59:56 broker; sell out; 0.02 lots at 149.973 (end of test). Native exit-comment categories: other_out_deals=0; sl=0; tester_forced=1; tp=0.
Native cash before any extra-cost scenario: price P/L 26.71, commission 0.00, recorded swap 2.97; balance 10000.00 to 10029.68. Historical swap validity is unverified. These observed SL/TP/comment paths do not prove every source branch, stop path, sizing path, restart behavior, or durable profitability.
Tester boundary: The native tester omitted 2 approved source ticks in the final broker second of 29 February 2024; All native cases exactly match source count with the final broker second excluded. This is a bounded tester boundary discrepancy, not a missing source file; no claim of complete inclusion of that second.
Indicator history was available to the tester, but warmup quality and every seed path were not independently audited.
Older broker reports below remain historical and use their own data assumptions. This approved-data month is a separate, hash-bound functional diagnostic.
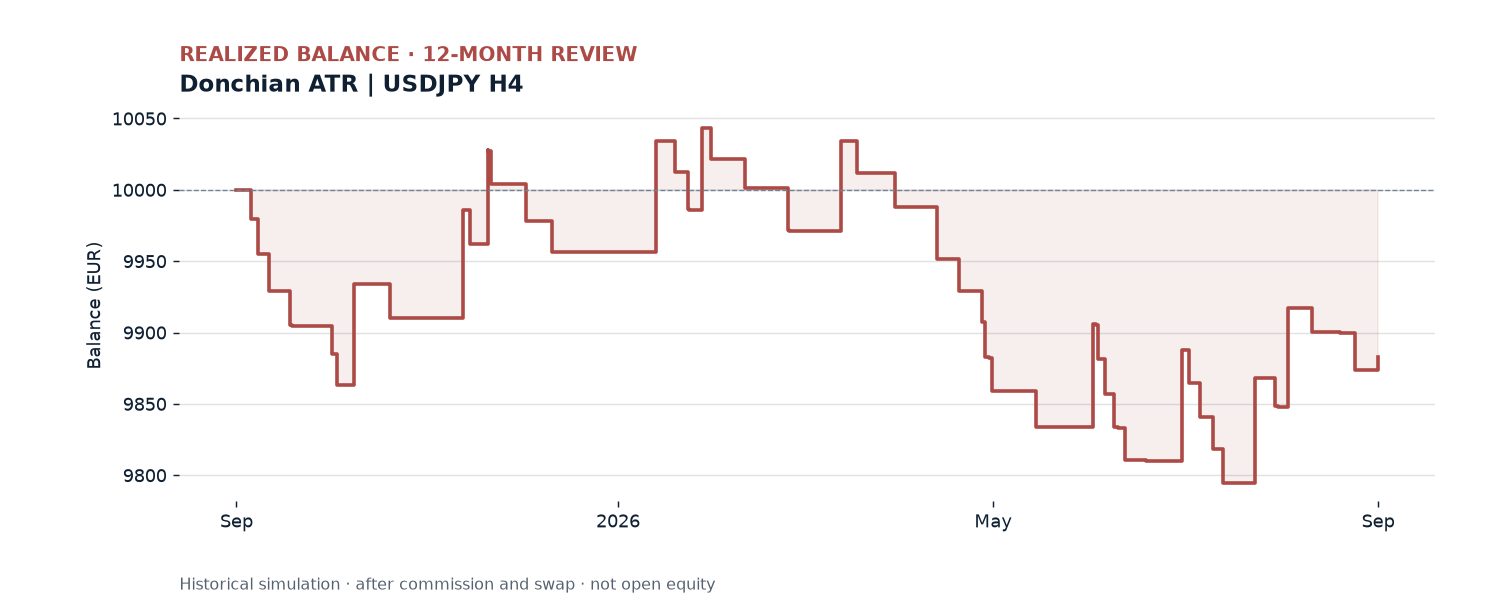
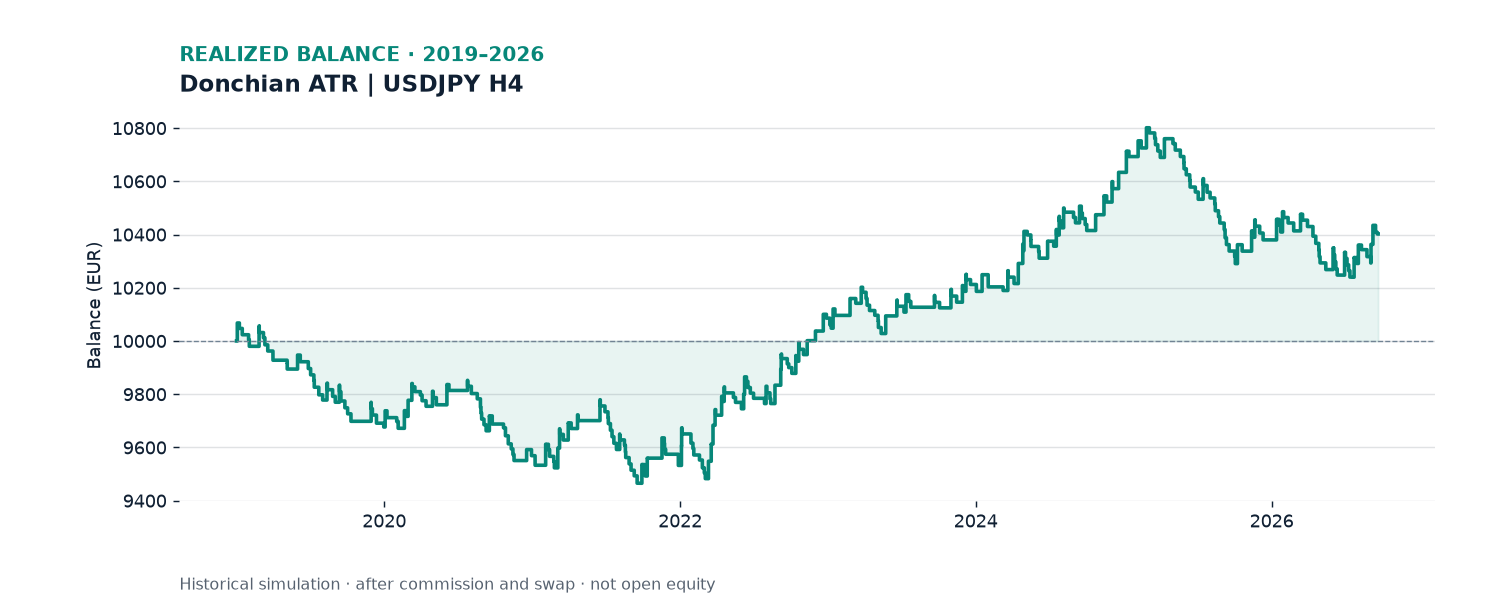
Selected configuration: rolling-year net EUR -116.92; full-period net EUR +402.19. Negative confirmation is retained in the archive.
How this strategy works
- On each completed H4 bar, compare its close with the preceding 20-bar Donchian high and low; the signal bar is excluded from the channel.
- Buy a close above the channel only when it is above EMA100; sell a close below the channel only when below EMA100.
- The selected stop is 2 × ATR14 (or the broker minimum if wider), with a target at 3 times the initial stop distance. The selected entry-risk input is 0.25%.
- New entries require the spread and daily equity-loss checks and no existing position on the symbol. The optional original broker-hour filter is disabled in this selected preset.
The selected configuration uses USDJPY / H4, variant s0. All indicator and session values used by this build are listed in the preset editor.
Broader time-series momentum research. The download is a documented research adaptation; results from the reference do not establish results for this EA.
Measured backtests
| Period / model | Net EUR | PF | Trades | Equity DD | Native report |
|---|---|---|---|---|---|
| Development 2019.01.01 → 2024.01.01 M1 OHLC screening | +238.16 | 1.07 | 197 | 5.99% | MT5 report |
| Validation 2024.01.01 → 2025.01.01 M1 OHLC screening | +492.62 | 1.98 | 39 | 1.47% | MT5 report |
| 12-month review 2025.09.01 → 2026.09.01 Real-tick mode + fallback | -116.92 | 0.86 | 46 | 2.68% | MT5 report |
| Long review 2019.01.01 → 2026.09.21 Real-tick mode + fallback | +402.19 | 1.08 | 314 | 6.12% | MT5 report |
Adjust the strategy preset
MT5 also validates parameter combinations and may reject incompatible inputs. Session modes use local London, New York and Tokyo hours. Broker-time conversion uses the configured winter UTC offset and DST rule. A session filter limits eligible entries; it does not change the underlying strategy signal or create trades where none qualify. Policy 2 also closes before the chosen session ends.
Install and reproduce the test
- Download and extract the ZIP. Copy
TF_Donchian_ATR_Assistant_Sessions.ex5intoMQL5/Experts/TradeForexin the MT5 data folder. Keep MQ5 and all MQH headers together if compiling. - Open Strategy Tester, select the EA, USDJPY and H4. The build rejects normal chart execution.
- Load the included
selected-test.setor a preset downloaded above. Symbol, chart timeframe, dates, deposit and tick model are tester settings outside the .set file. - For confirmation choose “Every tick based on real ticks”, EUR 10,000, 1:30 leverage and 100 ms delay. Use 2025.09.01–2026.09.01 or 2019.01.01–2026.09.21; retain the generated report and Journal.
- Allow MT5 to obtain the available broker history. Compare actual date coverage, costs, trade count and history quality; a later download or different broker server can change the result.
Read the general MT5 installation guide; this package’s tester-only restriction takes precedence over normal chart-activation steps.
What these results can establish
- Tested values are research settings, not a profitability claim.
- Broker history, spread, swaps and fills can change outcomes.
- These are retrospectively selected historical tests. Development, validation and review periods overlap previously inspected history; this is not a fresh independent holdout.
- The balance plots show realized outcomes. Equity drawdown includes floating positions and must not be inferred from the balance line alone.
- Available native ticks and fallback are accepted. Missing ticks, historical spread paths and cost assumptions limit confidence; profitable history does not guarantee future profitability.
- RiskPercent is an entry-sizing estimate, not a hard loss cap. Costs, gaps and slippage can exceed that estimate; some legacy sizing excludes transaction costs.
Additional cost stress adds 25% of the absolute commission and swap amounts: 12-month stressed net EUR -139.43; long-period stressed net EUR +190.18. This is not a full spread or slippage stress.
Files and reproducibility
Each ZIP includes MQ5 source, required headers, EX5, README, selected-test.set, selection.json and SHA256SUMS.txt. Compiled builds and measured results are unchanged by this documentation update.
ZIP SHA-256bec8a8fbf5d31aff55b7a33e1f0d4b976693dd8f70f004c0bcd87f79eed66465
Tested EX5 SHA-25666123ed3fe0a9f2393a87ecfb22dc36027a9f10a01b479c07ceaa7b767bb6e74
Selection criteria and all strategy categories · Frozen selection record
Frozen USDJPY H4 cost-research campaign
Research evidence only; no profitability badge. Twenty frozen runs comprise ten independent USD 10,000 resets from 2 July 2018 to 18 September 2026 (end exclusive), each repeated with base USD 3.50 per lot-side / 0 ms and stress USD 7.00 per lot-side / 200 ms. The tester-only cost wrapper is distinct from the downloadable public EX5. The campaign used the already selected preset unchanged; windows were chosen for documented data coverage. These are retrospective tests, not a fresh holdout.
Price P/L, declared fee withdrawals, and the native tester swap field are shown separately. Historical swap validity is unverified, so the pre-swap result is retained alongside the native-swap presentation.
Reviewed rejected entries are unfilled server attempts, not fills or fee events. They retain non-clean execution and skipped-signal uncertainty; later valid signals remain separate observations.
| Scenario | Fee/lot-side | Delay ms | Price P/L | Declared fees | Net before unverified swap | Native swap | Net with native swap | PF | Tester-end closes | Reviewed rejected entries |
|---|---|---|---|---|---|---|---|---|---|---|
| base | 3.50 | 0 | 230.49 | 103.60 | 126.89 | -75.99 | 50.90 | 1.023 | 8 | 4 |
| stress | 7.00 | 200 | 217.80 | 207.06 | 10.74 | -76.20 | -65.46 | 1.002 | 8 | 4 |
What the result means: Each scenario contains 335 closed positions, including 90 winners and 245 losers before swap. The base scenario totals USD 126.89 after fees, while stress leaves USD 10.74. With the unverified native swap field included, the totals become USD 50.90 and USD -65.46. The small margin is sensitive to costs and financing; it does not demonstrate robust profitability.
PF is the pooled closed-position profit factor after declared fees, before unverified swap. The two scenarios are alternative cost assumptions over the same fixed windows, not independent portfolios. Segment rows below retain all planned windows and tester-end closes; they do not form a continuous equity curve.
All 20 frozen segment results
| Case | Broker dates | Scenario | Fee/lot-side | Delay ms | Net before swap | Native swap | Net with swap | Tester-end closes | Reviewed rejected entries |
|---|---|---|---|---|---|---|---|---|---|
| dcost-01-20180702-20181224-base-v1 | 2018-07-02–2018-12-24 | base | 3.50 | 0 | -205.93 | -34.06 | -239.99 | 1 | 0 |
| dcost-01-20180702-20181224-stress-v1 | 2018-07-02–2018-12-24 | stress | 7.00 | 200 | -215.12 | -34.06 | -249.18 | 1 | 0 |
| dcost-02-20190103-20190524-base-v1 | 2019-01-03–2019-05-24 | base | 3.50 | 0 | -149.31 | 7.87 | -141.44 | 1 | 1 |
| dcost-02-20190103-20190524-stress-v1 | 2019-01-03–2019-05-24 | stress | 7.00 | 200 | -153.43 | 7.87 | -145.56 | 1 | 1 |
| dcost-03-20190529-20191224-base-v1 | 2019-05-29–2019-12-24 | base | 3.50 | 0 | -146.55 | -14.65 | -161.20 | 1 | 1 |
| dcost-03-20190529-20191224-stress-v1 | 2019-05-29–2019-12-24 | stress | 7.00 | 200 | -155.05 | -14.65 | -169.70 | 1 | 1 |
| dcost-04-20200103-20201224-base-v1 | 2020-01-03–2020-12-24 | base | 3.50 | 0 | -85.53 | -90.57 | -176.10 | 1 | 0 |
| dcost-04-20200103-20201224-stress-v1 | 2020-01-03–2020-12-24 | stress | 7.00 | 200 | -96.88 | -90.57 | -187.45 | 1 | 0 |
| dcost-05-20210105-20220101-base-v1 | 2021-01-05–2022-01-01 | base | 3.50 | 0 | 50.03 | 29.46 | 79.49 | 1 | 1 |
| dcost-05-20210105-20220101-stress-v1 | 2021-01-05–2022-01-01 | stress | 7.00 | 200 | 22.77 | 29.25 | 52.02 | 1 | 1 |
| dcost-06-20220101-20230101-base-v1 | 2022-01-01–2023-01-01 | base | 3.50 | 0 | 533.91 | -5.41 | 528.50 | 1 | 0 |
| dcost-06-20220101-20230101-stress-v1 | 2022-01-01–2023-01-01 | stress | 7.00 | 200 | 520.44 | -5.41 | 515.03 | 1 | 0 |
| dcost-07-20230101-20231222-base-v1 | 2023-01-01–2023-12-22 | base | 3.50 | 0 | 10.97 | 10.69 | 21.66 | 0 | 0 |
| dcost-07-20230101-20231222-stress-v1 | 2023-01-01–2023-12-22 | stress | 7.00 | 200 | 3.27 | 10.69 | 13.96 | 0 | 0 |
| dcost-08-20240103-20241224-base-v1 | 2024-01-03–2024-12-24 | base | 3.50 | 0 | 434.56 | 28.09 | 462.65 | 1 | 0 |
| dcost-08-20240103-20241224-stress-v1 | 2024-01-03–2024-12-24 | stress | 7.00 | 200 | 424.32 | 28.09 | 452.41 | 1 | 0 |
| dcost-09-20250104-20251224-base-v1 | 2025-01-04–2025-12-24 | base | 3.50 | 0 | -281.99 | -14.15 | -296.14 | 1 | 0 |
| dcost-09-20250104-20251224-stress-v1 | 2025-01-04–2025-12-24 | stress | 7.00 | 200 | -291.46 | -14.15 | -305.61 | 1 | 0 |
| dcost-10-20260106-20260918-base-v1 | 2026-01-06–2026-09-18 | base | 3.50 | 0 | -33.27 | 6.74 | -26.53 | 0 | 1 |
| dcost-10-20260106-20260918-stress-v1 | 2026-01-06–2026-09-18 | stress | 7.00 | 200 | -48.12 | 6.74 | -41.38 | 0 | 1 |
Download the 20 segment results and scenario totals (JSON).
These observations do not establish future performance, historical financing accuracy, full indicator warmup/seed behavior, or real-account fills.