
Follow the MT5 indicator installation guide for file locations, chart setup and troubleshooting. The walkthrough uses ATR Risk Bands; use this indicator’s own inputs and dependencies.
Already have a compatible account? You can use it. Otherwise, compare broker eligibility, platforms and costs before choosing.
Donchian breakouts, EMA context and ATR reference levels
TF Donchian ATR Channel is a non-trading chart indicator. It displays the rule set used by the matching trend EA while leaving every decision and order with the trader.
Individual ZIP with .mq5 source, .ex5 binary, README and checksums.
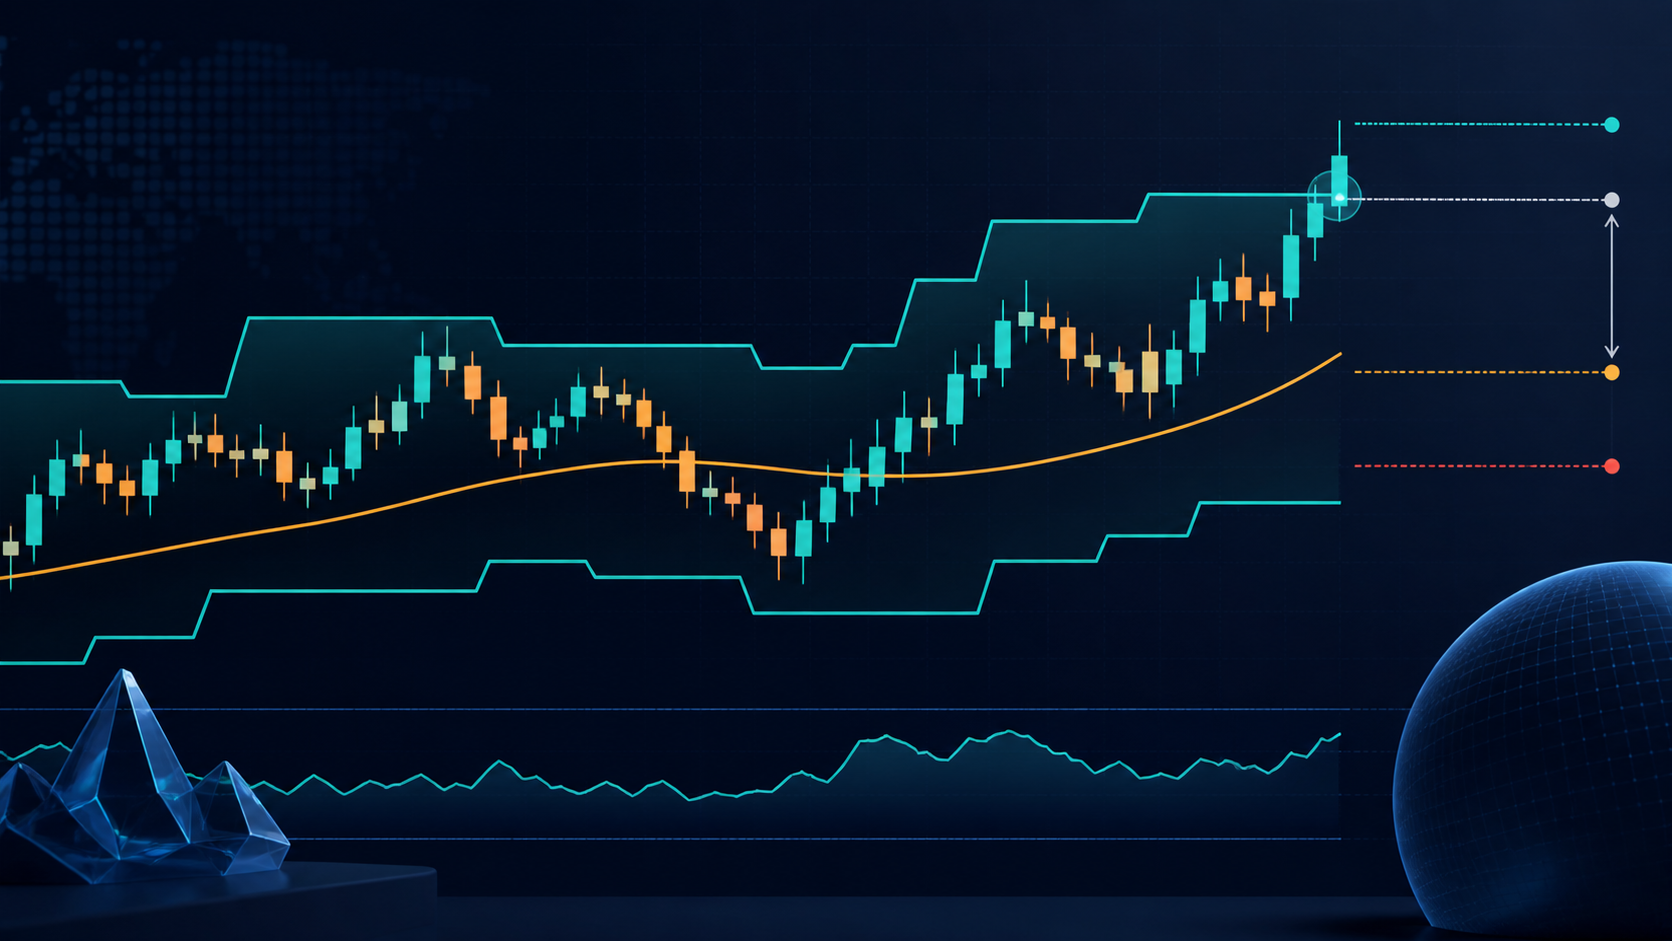
What appears on the chart
| Output | Default construction | Interpretation |
|---|---|---|
| Donchian upper | Highest high of the preceding 55 completed bars | Reference boundary for an upside breakout. |
| Donchian lower | Lowest low of the preceding 55 completed bars | Reference boundary for a downside breakout. |
| EMA filter | EMA 200 of close | Long-term directional context, not a prediction. |
| Long marker | Completed close above upper channel and EMA | Potential trend-continuation context. |
| Short marker | Completed close below lower channel and EMA | Potential downside-trend context. |
| Long ATR reference | Close minus 2.2 × ATR 14 | Volatility-scaled distance, not guaranteed exit price. |
| Short ATR reference | Close plus 2.2 × ATR 14 | Mirrored volatility reference. |
Completed bars only
The indicator deliberately ignores the currently forming candle when it creates a marker. That reduces intrabar flicker, but it also means the marker appears only after the candle has closed and may be later than the initial price move.
Same visible concept
The corresponding Donchian ATR Expert Advisor uses the same core breakout, EMA and ATR concepts plus position sizing, spread and daily-loss controls. Install automation only after reviewing that separate documentation.
What the evidence can—and cannot—say
Donchian breakouts are one transparent way to operationalize trend following. Research by Moskowitz, Ooi and Pedersen found time-series momentum across currencies and other futures/forward markets. That is evidence for studying the strategy family, not a validation of this indicator, a 55-bar lookback, any timeframe or future performance.
Install, validate and interpret
- Extract only this indicator’s ZIP. Copy the .ex5—or both supplied files—to
MQL5/Indicators. - Refresh Navigator and attach it to a chart. It adopts that chart’s symbol and timeframe.
- Review how markers behave in trends, ranges, news gaps and wide-spread periods. Compare brokers if historical feeds differ.
- Define entry, stop, sizing and portfolio rules independently. An ATR reference line is not a complete risk plan.
- Forward-observe on demo before incorporating it into a repeatable process.
Known constraints
False breakouts are common in sideways markets; EMA and Donchian values lag price; ATR does not predict gaps; results depend on the broker’s price history. Version 1.00 compiled with 0 errors and 0 warnings. ZIP SHA-256: 44be67e57040703569eec5793dd081fed872ae015851efd3c585f9a61ae6c431.
Choose a compatible platform for your country
Compare MT5 access, the contracting company and total trading costs. A new or funded account is not required to download this tool.
Compare broker reviews · Read the Tickmill EU review · Check HFM eligibility
HFM Europe currently does not accept retail or elective professional clients. Broker reviews identify affiliate links; we may receive compensation from qualifying referrals.